BREAKING: Strategy CFO Andrew Kang, Director Jarrod Patten on MSTR Stock Selling Spree

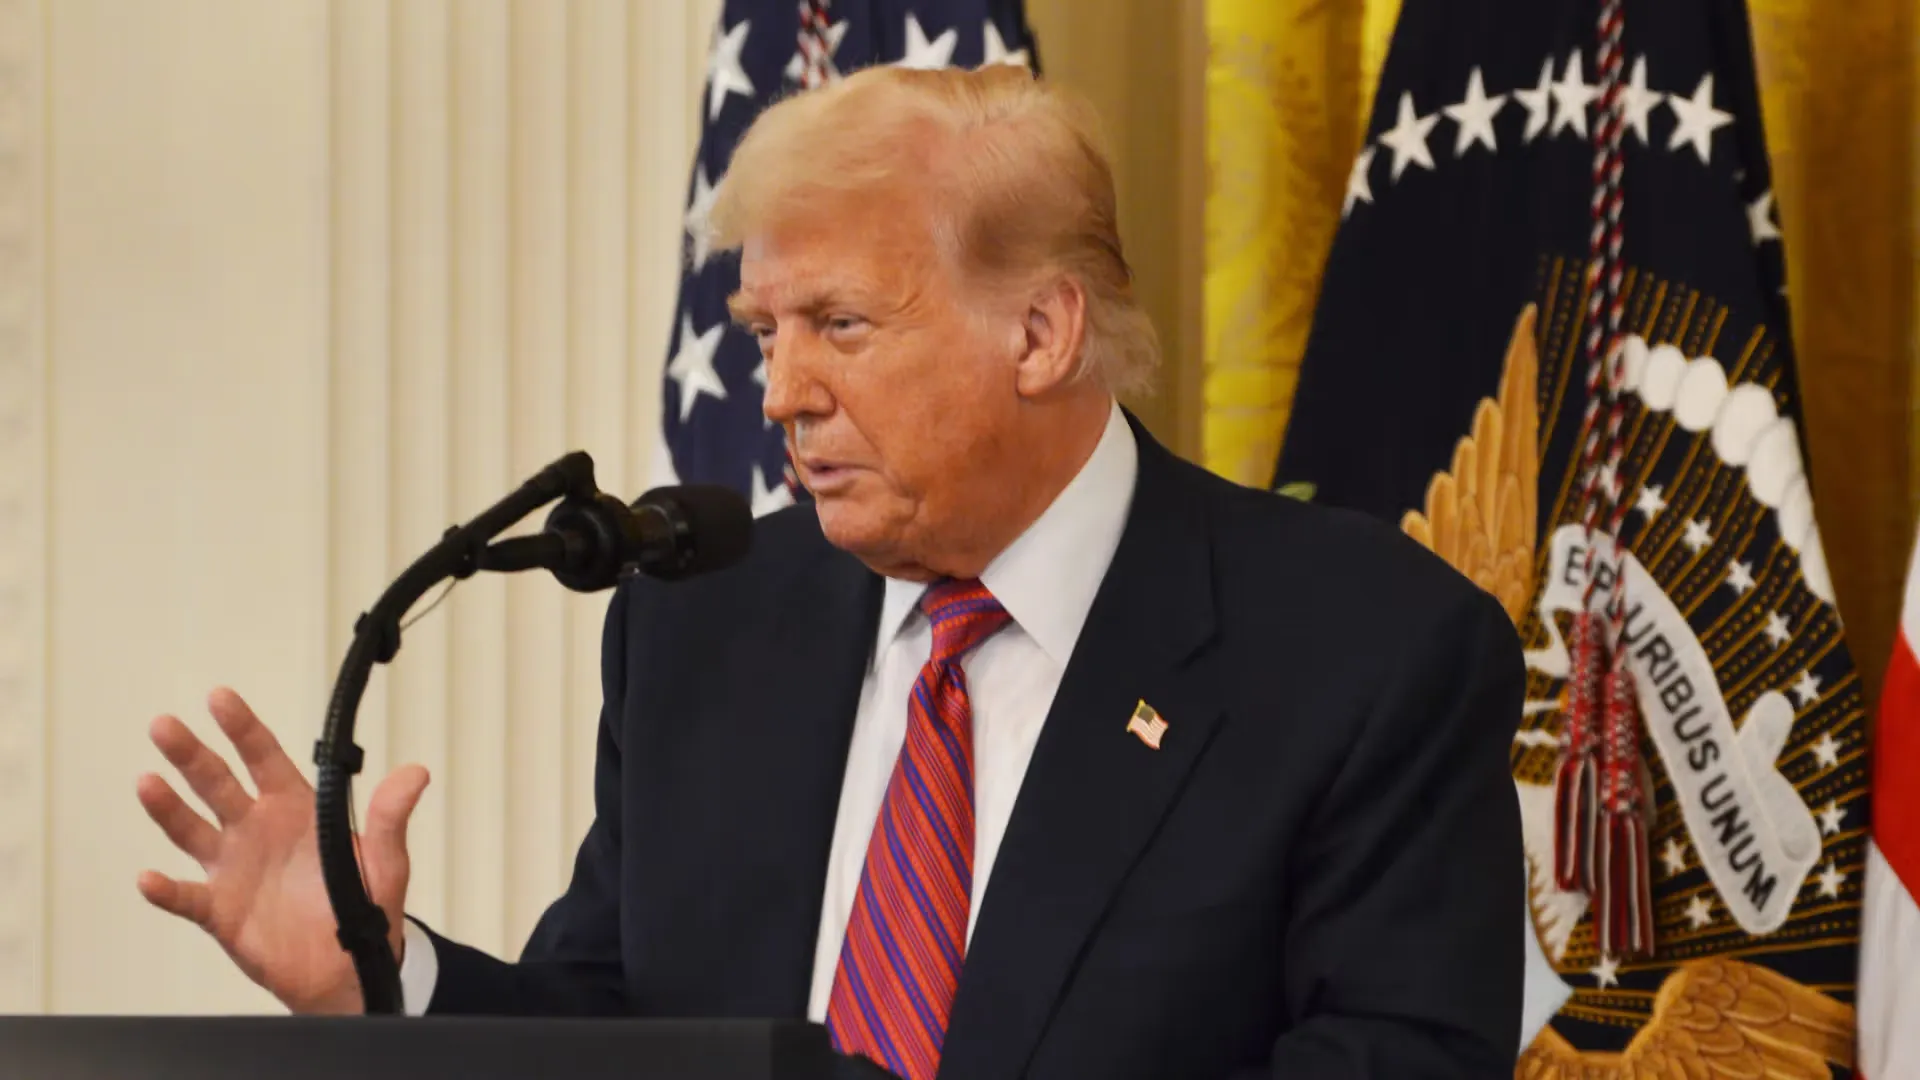
Strategy CFO Andrew Kang Sells MSTR Stock.   On the other hand, Strategy director Jarrod Patten has sold massive shareholdings in the last few months. MicroStrategy share dilution, lower analyst forecasts, and a massive correction in the US stock market amid the US-Iran war have turned investors cautious.  Director Jarrod M. Patten sold 5,250 MSTR stocks in the last few days. Following the reported transactions, Pattens direct ownership in Class A Common Stock stands at 28,000 shares. In addition, he holds various Series A Perpetual Preferred stocks.  Shares Falling amid Bitcoin Selling Pressure  MSTR stock price closed 0.58% lower at $164.85 on Thursday amid a broader sell-off in US stock and crypto markets. The intraday low and high were $162.40 and $168.71, respectively. Trading volume was also below the average volume of 18 million.  In premarket trading today, MSTR stock is trading 0.20% lower at $164.20. The stock has erased more than 9% in a week. MicroStrategy stock is up 5% year-to-date but down almost 58% over the past year.  Analysts from TD Cowen retained a buy rating and raised price target to $400 for MSTR stock. Also, Bernstein analyst Gautam Chhugani has set a 12-month price target of $450.  Bitcoin is trading at $77,384, with a

05-23Industry

Binance XRP Withdrawals Hit Highest Share Since April

Binance XRP withdrawals hit 53% as whale outflows dominate exchange activity.XRP struggles near $1.34 support after repeated rejection below $1.41.Coinbase whale outflows weaken as mid-sized XRP holders gain market share.  XRP exchange activity has started showing a clear split across major trading platforms as traders monitor weakening price momentum near the $1.34–$1.37 range. Recent CryptoQuant data points to rising withdrawal activity on Binance, cooling deposit pressure on Bybit, and diverging whale behavior between Binance and Coinbase.  The changing exchange structure comes as XRP trades near important technical support after losing strength below the $1.41 resistance zone. Market participants now watch whether the current withdrawal-heavy setup could reduce selling pressure or whether the broader downtrend will continue dominating price action.  Binance Withdrawals Regain Dominance  CryptoQuant data shows Binance XRP withdrawal transactions climbed to 53% on the seven-day transaction-share chart. Meanwhile, deposit transactions dropped to 47%, marking one of the strongest withdrawal readings since April 10.  The earlier April reading showed withdrawals reaching 53.4% while XRP traded near $1.34. XRP now trades close to that same region around $1.37, making the repeated structure notable for short-term traders.  In market terms, stronger withdrawal activity suggests more XRP leaves Binance instead of entering the exchange. Consequently, traders often interpret this

05-23Industry

Dogecoin Price Prediction: Can DOGE Finally Break Above $0.15?

Dogecoin is holding inside a long consolidation range as traders track signs of accumulation near key support. The latest daily and weekly charts point to $0.15 as the main upside level, but DOGE still needs a confirmed breakout above resistance.  Dogecoin Eyes $0.15 Breakout After Long Consolidation  Dogecoin is moving inside a long consolidation range after months of sideways trading on the daily chart. The setup shared by BitGuru shows DOGE holding above the lower support zone near $0.088, while price tries to build strength below the next resistance levels.  DOGE Daily Consolidation Chart. Source:  The chart marks an earlier liquidity sweep, where DOGE briefly moved above a prior high before dropping back into the range. That move cleared upside liquidity, then price returned to a lower base. Since then, DOGE has traded in a tighter structure instead of continuing the downtrend.  The key breakout area now sits around $0.127 to $0.131. A clean move above that zone would strengthen the recovery setup and open the way toward $0.140, then the larger target near $0.150.  However, DOGE still needs stronger momentum. The current structure shows accumulation and compression, but not a confirmed breakout yet. If price fails to hold the consolidation range, the lower support near

05-23Industry

Nakamoto Ticker NAKA Implements 1-for-40 Reverse Stock Split

Nakamoto (NASDAQ: NAKA), a Bitcoin treasury company, will execute a 1-for-40 reverse stock split on Friday, aiming to lift its share price above Nasdaqs $1 minimum bid requirement. The move comes as the company faces potential delisting, having traded below $1 for 30 consecutive business days since December 10, 2025, according to SEC filings.  The reverse split, approved by shareholders earlier this month, will consolidate every 40 shares into one, reducing total outstanding shares from 696.1 million to 17.4 million. While the companys market capitalization remains unchanged, such actions are typically aimed at boosting per-share prices to meet listing requirements. Shares of NAKA closed at $0.16 on Wednesday, down 7.5% for the day and over 99% from their May 2025 highs of $25.  “The reverse stock split is intended to increase the per-share trading price of the companys common stock to regain compliance with the $1 minimum bid price requirement for continued listing on the Nasdaq Global Market,” Nakamoto stated in a release. The company has until June 8 to maintain a $1 share price for at least 10 consecutive days to avoid delisting.  Reverse stock splits have become increasingly common in 2026 among struggling Nasdaq-listed companies. Lunai Bioworks, Brera Holdings, and Ernexa

05-23Industry

Brent Oil Price Risks Drop Below $100 as Trump’s Iran Talks Trigger Long Exodus

Brent oil price trades at $104.70 on May 22, sitting below one critical technical level. President Trumps call for a fast Iran deal is pulling the geopolitical risk premium out of crude.  Hedge funds are cutting longs, put hedging is climbing, and the chart is testing channel support. The three signals are now lining up for a critical Brent crude test.  Trumps Iran Talks Pull Brent Oil Toward a Channel Break  “We‘re going to end that war very quickly. They want to make a deal so badly. They’re tired of this”  President Trump predicts a deal to end the war with Iran is going to happen “fast” — and that oil prices will plummet when the agreement is reached.  The statement marks the clearest de-escalation signal from the White House this month. Geopolitical risk had been the main bid under crude since April.  Brent has been climbing inside an ascending parallel channel since April 17. The structure is a bullish formation where price rises between two parallel upward trendlines.  Brent Channel Structure: TradingView  The recent slide has pushed Brent against the channels lower boundary. A clean break of that line would flip the trend from bullish to neutral/bearish, opening downside for the first time in five weeks. That

05-23Industry

Ethereums (ETH) Survival in Question as Investors Pivot Like Never Before

Capital flows arent looking good  As investor sentiment declines in both institutional and retail markets, Ethereum is about to enter one of its most uncertain periods in years. ETH, which was once thought to be the unquestionable second pillar of cryptocurrency behind Bitcoin, is currently facing increasing skepticism due to ETF withdrawals, slowing network growth, and an aggressive shift in market attention toward competitors that move more quickly.  Capital flows arent looking good  A significant imbalance in demand was revealed by the recent launch cycle of spot cryptocurrency ETFs. Ethereum-related funds were unable to create the same momentum as Bitcoin products, which attracted billions in institutional inflows. Concerns that traditional investors no longer view Ethereum as the markets strongest growth story have been reinforced by the persistent outflows from a number of ETH ETFs in recent weeks.  ETH/USDT Chart by TradingView  Retail traders, on the other hand, seem less and less inclined to wait for Ethereums long-term strategy to materialize in terms of price performance. Higher-volatility industries, such as Solana-based assets, tokens connected to AI, and meme coins, have seen a quick rotation of capital. Ethereum benefited greatly from being the default destination following Bitcoin rallies in prior cycles. The rotation pattern appears to be

05-22Ethereum

$725 Million in Ethereum (ETH) Just Left Whale Wallets: The Timing Is Suspicious

Ethereum (ETH) price trades at $2,132 on May 22, holding flat after a small rebound off recent lows. The action masks a deeper split between two on-chain cohorts pulling in opposite directions.  The price chart, whale supply data, and conviction holder behavior each tell different stories. Resolving the conflict points to one of two outcomes for Ethereum in the coming sessions.  Price Pattern and Whale Exit Point to Downside Risk  Ethereum has been trading inside an inverted cup and handle since March 29. The pattern is a bearish reversal formation where price climbs in a rounded arc before rolling over. The cup completed near May 18, with the small rebound since then forming the handle.  If the handle gives way, the measured move points to a 19% correction. The downside math would set up a cycle reset for Ethereum back to early February territory.  Ethereum Price Pattern: TradingView  Ethereum whales have been adding pressure to that scenario. Santiment data shows the supply held by whales (exchanges excluded) sat at 125.36 million ETH on May 17. The reading has since drifted to 125.02 million. This is a drop worth $725 million at the current ETH price.  ETH Whale Supply: Santiment  The whale exit started in mid-May, coinciding exactly with

05-22Ethereum

What the CLARITY Act means for Ethereum

The CLARITY Act would formally treat Ethereum as a digital commodity under CFTC oversight if it becomes law, stripping the SEC of latitude to call ETH a security and ending years of jurisdictional ambiguity.The bill creates a three-part taxonomy: digital commodities, investment contract assets and payment stablecoins.Ethereum is explicitly named as a digital commodity if its network meets “mature blockchain” criteria.The Act shifts spot ETH oversight to the CFTC while leaving securities-style fundraising under SEC rules.  Coincidentally or not, the political class has finally admitted what the market already assumed: Ethereum is not a stock.  The Digital Asset Market Clarity Act of 2025 (the CLARITY Act) is a U.S. market‑structure bill that classifies most blockchain‑native tokens, including ether, as “digital commodities” rather than securities if their underlying networks are sufficiently decentralized and functional.  Under the bills taxonomy, digital commodities are “digital assets whose value is intrinsically linked to and derives its value from the programmatic operation of a crypto system,” while securities remain under SEC jurisdiction and payment stablecoins sit in a separate category Critically, policy analyses note that the Act explicitly names Ethereum (ETH) among 16 tokens treated as digital commodities, putting ether in the same bucket as bitcoin and placing its

05-22Ethereum

Zero Network Announces Closure: Ethereum Layer 2 Platform Sets July 2026 Deadline

Zero Network shutting down operations; users have until July 31, 2026, to withdraw assets.Gasless Ethereum Layer 2 platform ceasing operations after approximately 18 months.Zerion directing users to immediately bridge ETH, tokens, and NFTs off the network.Gasless rollup experiment concludes as company refocuses on wallet development.Closure reflects strategic pivot toward Zerions primary wallet and API offerings.  Zero Network, an Ethereum Layer 2 solution designed for gasless transactions, is ceasing operations following approximately 18 months of activity. This decision stems from Zerions strategic realignment to concentrate resources on its primary wallet and API offerings. Asset holders have been given a firm deadline of late July 2026 to withdraw their holdings.  Closure Timeline and Process  Launched in November 2024, Zero Network distinguished itself as the pioneering EVM-compatible rollup offering completely gasless transactions. The project sought to eliminate transaction costs and streamline the user experience across the Ethereum ecosystem. Yet operating an independent blockchain ultimately conflicted with the organizations broader objectives.  The termination affects all digital assets stored on Zero Network, including tokens, NFTs, and ETH. Deposits to the network have been disabled, requiring all participants to take action. Zerion maintains that all user holdings remain secure during this transition phase.  Participants can transfer their holdings to Ethereums main

05-22Ethereum

Ethereum Price Prediction: Why Traders Are Watching the $5K Zone Again

Ethereum is still holding its long term support structure, even as price remains far below its old high zone near $4,800 to $5,000. The charts show that ETH needs a weekly breakout first, but the macro setup has not turned into a full bearish breakdown yet.  Ethereum Holds Rising Support as Chart Points to $10K Target  Ethereum is trading near a long-term rising support line on the weekly chart, while the setup shared by Rendoshi AI points to a possible recovery path toward the previous resistance area and then higher levels.  The chart shows ETH still holding above the major ascending trendline that started after the 2022 bottom. This support has helped price form higher long-term lows, so losing it would weaken the broader structure.  ETH Weekly Trendline Chart. Source:  The first key test is the short descending trendline above the current price. ETH needs to break that line to show that selling pressure is slowing. Without that breakout, the bounce remains early and unconfirmed.  The next major resistance sits around the $4,800 to $5,000 zone. That area rejected ETH several times before, so a move back there would be the first serious test for bulls.  The green roadmap shows a possible breakout above that range, a

05-22Ethereum
1
...
383385
...
1000