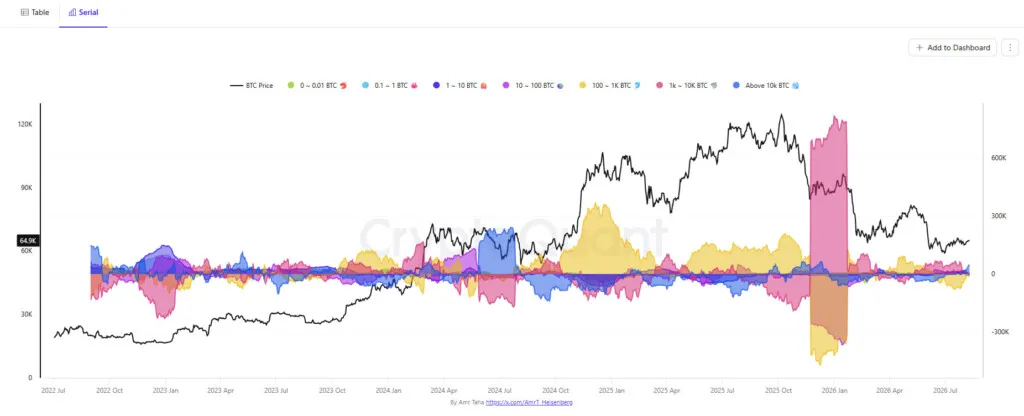
This BTC cohort has the fastest accumulation rate in 2026
The $BTC cohort holding over 10,000 $BTC in their wallets is the most active buyer in the summer of 2026. Almost all other wallet cohorts remain idle after the initial rush to accumulate in January. The biggest $BTC wallets, holding over 10,000 $BTC, may belong to organizations, ETFs, or the occasional whale. This cohort is closely watched for a sign of an end to the $BTC bear market. The cohort of the largest whales also showed accelerated accumulation in the past few weeks, just as $BTC recovered close to $65,000. For the past two months, the addresses holding over 10,000 $BTC accumulated a net 46,420 $BTC, their highest level since March 15. This group of whales also broke its record from March, when large wallets added 23,238 $BTC. $BTC whale wallets with over 10,000 coins entered a period of net accumulation in July and August, while other cohorts are still distributing. | Source: Cryptoquant At the same time, retail wallets entered a period of distribution. The smallest holders of 0.1 to 1 $BTC distributed 9,700 coins net. This cohort is volatile, often swinging wildly between accumulation and distribution. As of August, small-scale holders are decreasing their exposure, while the top whales are generating