BTC Price Today Analysis: Trends and Momentum Signals in September 2026
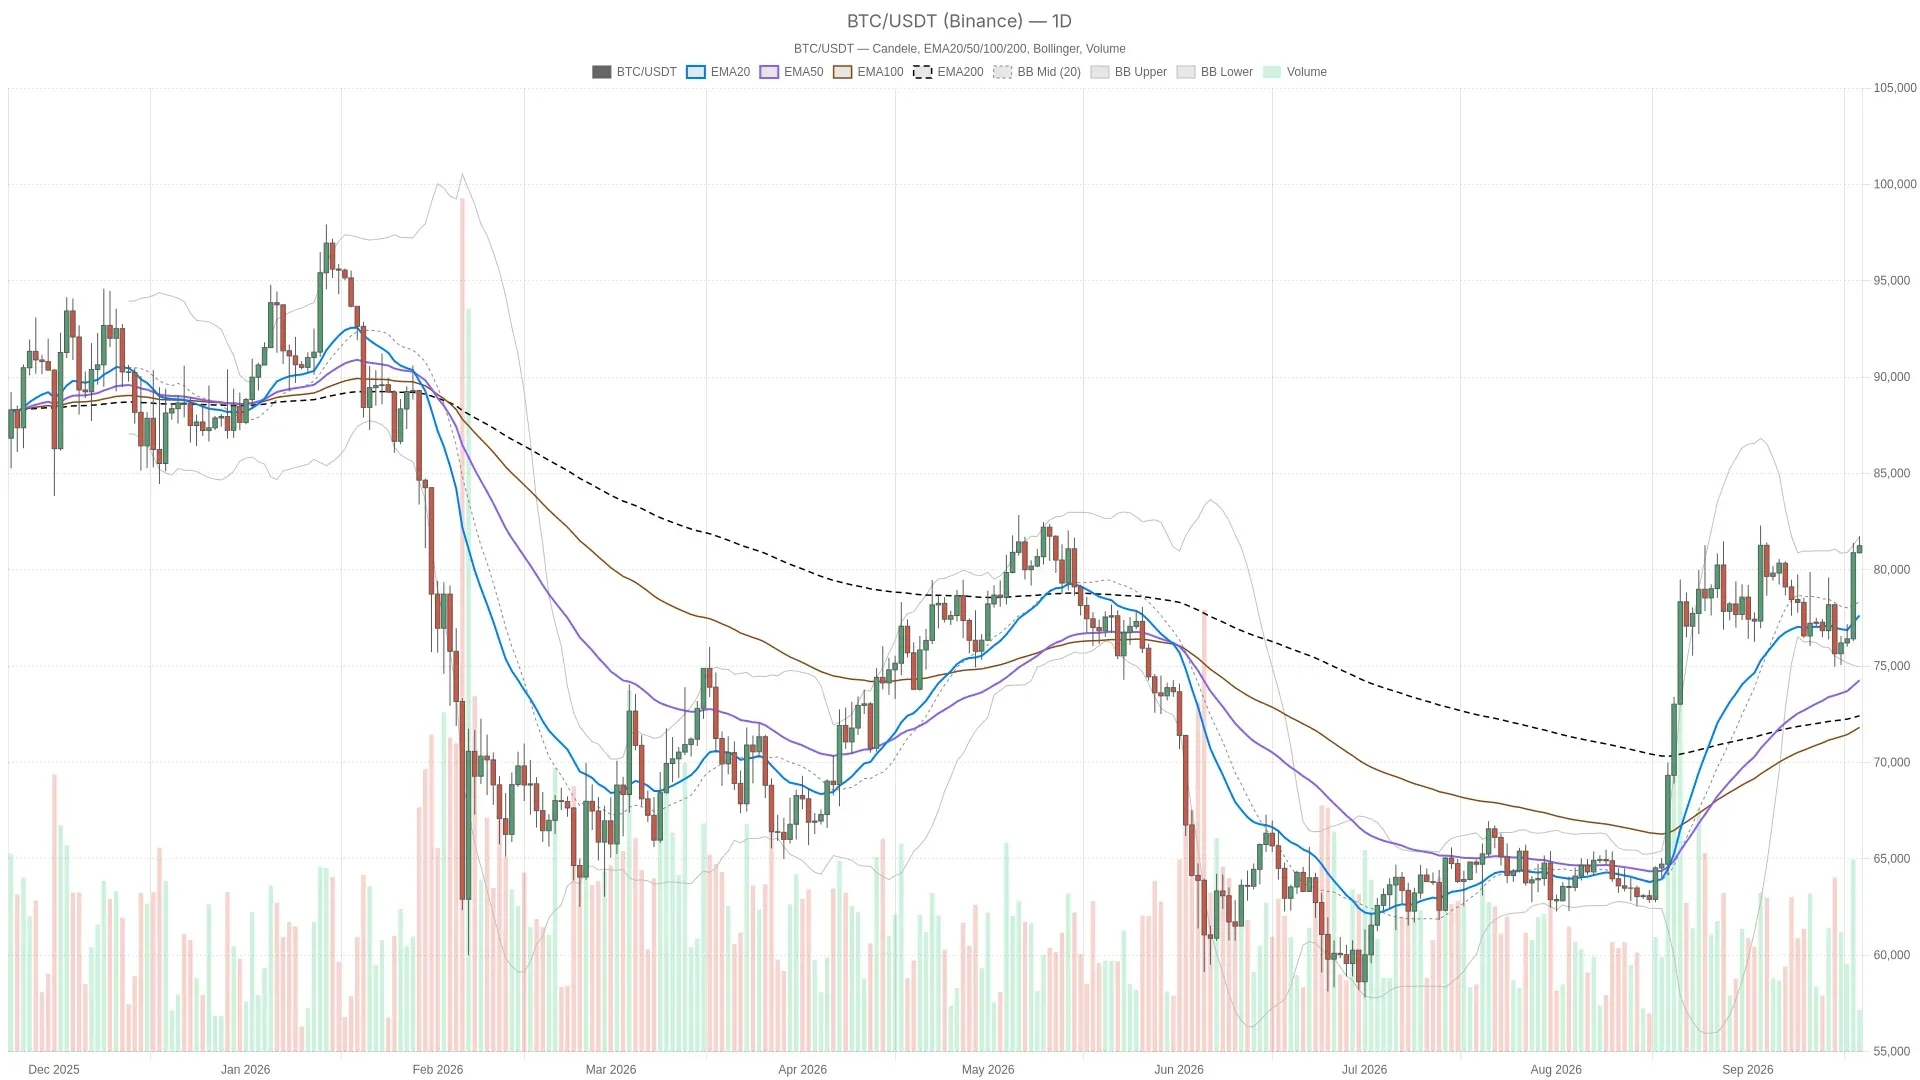
As of September 19, 2026, Bitcoin sits at $81,247.96, parked directly on the daily pivot. The broader bullish structure remains intact, but short-term momentum indicators are flashing caution. Examining the BTC price today reveals a market at a clear decision point between continuation and a corrective pullback. BTC/USDT — daily chart with candlesticks, EMA20/EMA50 and volume.Key takeawaysBitcoin trades at $81,247.96, with the daily EMA structure confirming a stacked bullish trend across all major moving averages.MACD on both daily and hourly charts shows negative histogram readings, signaling momentum deceleration despite price holding near highs.Fear a loss of $80,814.69would open the door to a retracement toward the daily 20-EMA. Daily Chart Still Belongs to the Bulls The daily chart remains structurally bullish, with Bitcoin holding above all three major EMAs in a textbook stacked uptrend. Price sits above the 20-EMA ($77,633.40), which sits above the 50-EMA ($74,269.81), which sits above the 200-EMA ($72,424.12). Every layer of trend-following moving average confirms the one below it, and there is no crossover or compression suggesting the trend is at risk. RSI on the daily is at 64.31, which is firm without being stretched. It is the kind of reading typical of a trend with real conviction — one that