Healthcare Triangle Analysis: Volatility Surge and Key Levels in 2026
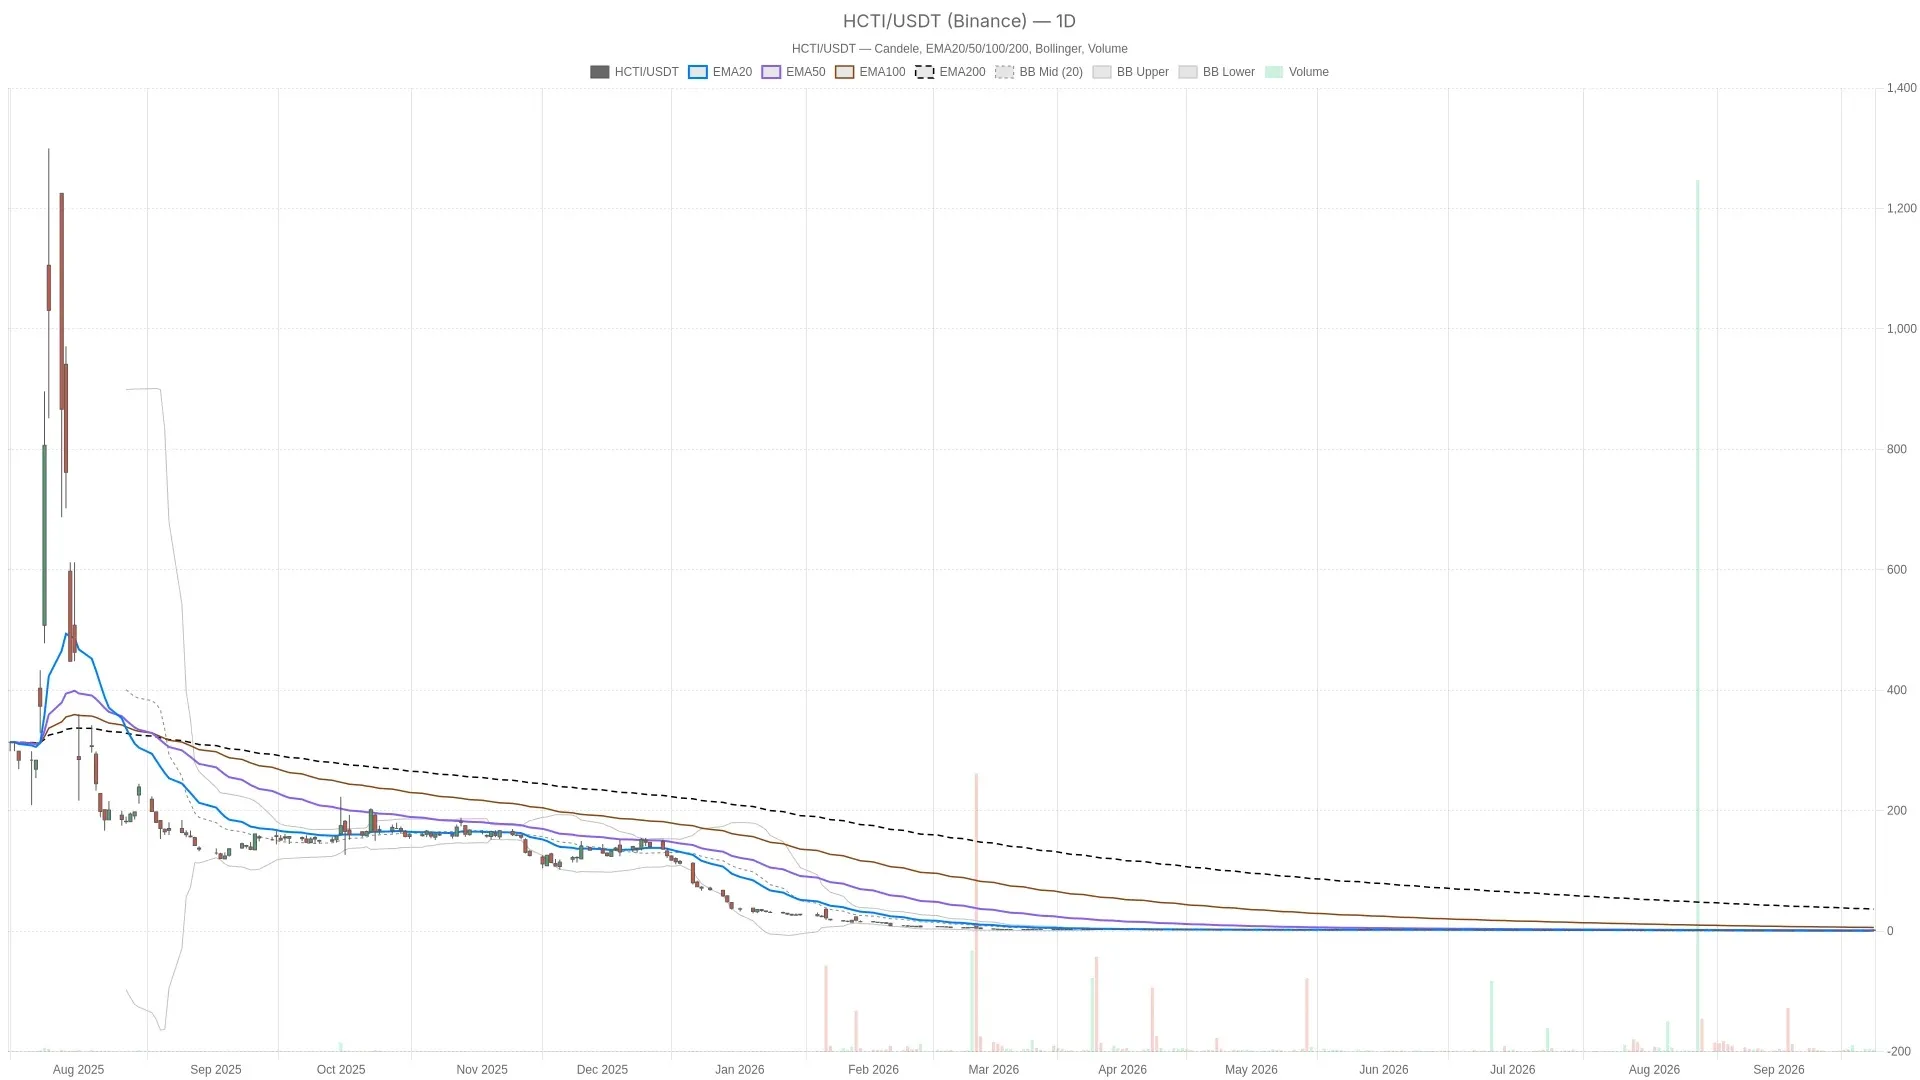
Healthcare Triangle (HCTI) stock is experiencing one of its most volatile sessions in recent memory. Shares swung from $1.28 to $3.07 intraday, with the daily close still unconfirmed near $1.60. Extreme overbought signals now clash with a neutral daily structure. HCTI — daily chart with candlesticks, EMA20/EMA50 and volume.Key takeawaysHealthcare Triangle (HCTI) intraday range hit $1.28–$3.07, far exceeding its typical daily range.Daily RSI14 stands at 76.3in overbought territory, while the 1-hour RSI14 has reached an extreme 95.65.Price trades well above the daily Bollinger upper band at $1.20and the 1-hour upper band at $1.46.The 200-day EMA sits at $36.64, underscoring a severe multi-year decline despite the short-term spike.Daily MACD has not confirmed a bullish trend reversal, with the MACD line still negative at -0.03. Healthcare Triangle Daily Chart: How Stretched Is Price? The daily chart shows Healthcare Triangle stock trading at a fraction of its 200-day EMA. That long-term average sits at $36.64, and the gap reflects a severe multi-year decline rather than a recent event. Daily RSI14 at 76.3confirms overboughtconditions. The most striking feature on the daily chart is not the spike itself, but the distance between price and the long-term average. Notably, Healthcare Triangle stock trades at a small fraction of its moving