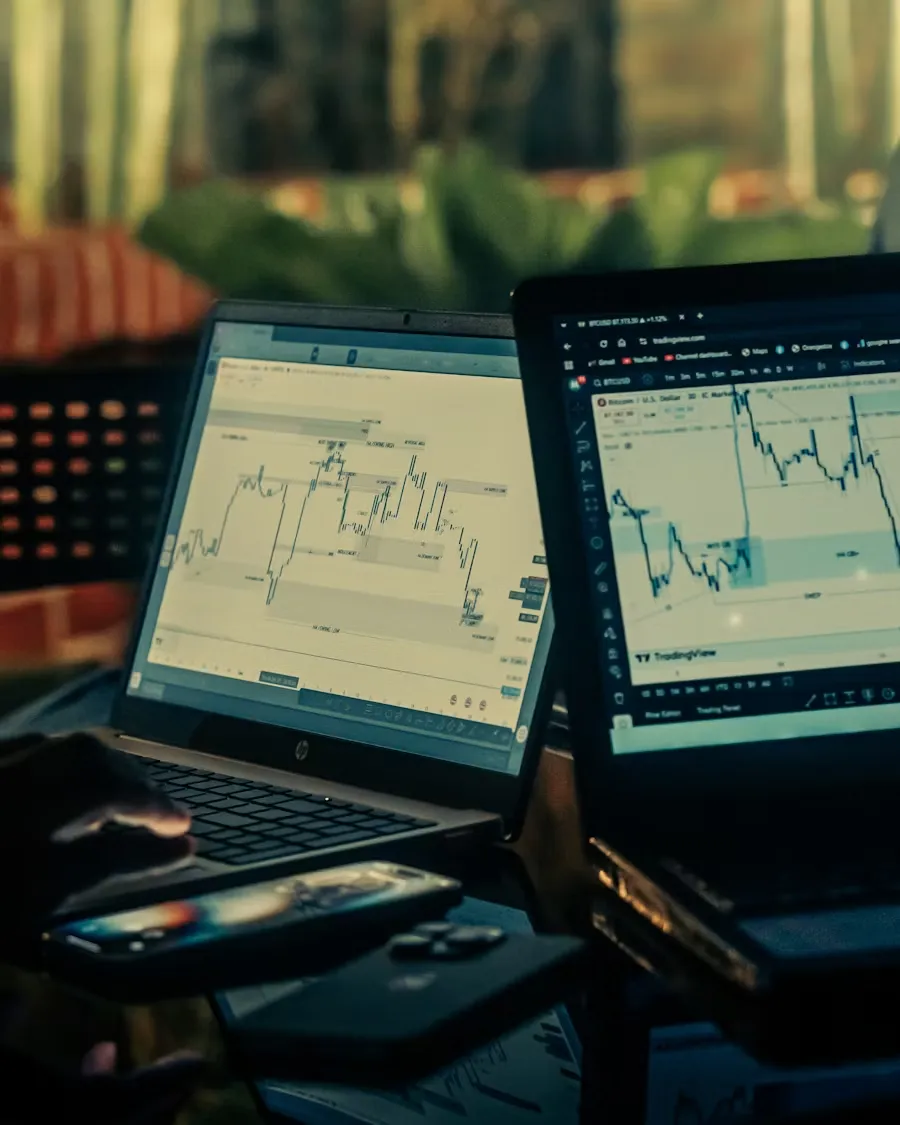
Tillis Accelerates Stablecoin Bill: BTC Effect

Senator Tillis Gives Green Light to Stablecoin Legislation  Senator Thom Tillis was at the center of negotiations with bankers over stablecoin yields, which had been delaying the market structure legislation that would fully integrate the crypto sector into the US financial system for months. Tillis emphasized in statements to journalists on Wednesday that he had largely addressed concerns that the Digital Asset Market Clarity Act threatens the banking lobby‘s interest-bearing deposits. The Republican senator, stating that the bill is Washington’s top priority, called on the committee chairman to proceed to the markup stage. According to the Fox Business record, he said, “I will encourage it to move forward.” This statement has the potential to resolve the bills stalled progress.  Banker Negotiations and BTC Liquidity Integration  The bill had been put on hold in recent months with the additional negotiation time granted to Tillis‘s bankers; stablecoin yields were seen as competitors to traditional bank deposits. The senator stated that they would share a compromise text on stablecoin rewards before the hearing and give stakeholders a final chance. If bankers return to the table in good faith, a few more points could be resolved. This regulatory clarity could strengthen BTC-USD pairs by boosting spot market

05-03Industry

Top 10 Privacy Token Catalysts of Q1 2026: From Monero’s FCMP++ to Dash Evolution

Tech  Top 10 Privacy Token Catalysts of Q1 2026: From Moneros FCMP++ to Dash Evolution  Privacy tokens had a busy first quarter. Major upgrades shipped. New partnerships landed. Some tokens posted double-digit weekly gains.  Top 10 Privacy Token Catalysts in Q1 2026  Here is a recap of what the top tokens achieved in the first quarter of 2026:$ZEN (Horizen): Completed its long-awaited migration to the Ethereum L2 network “Base” in Q1, a move to unlock better DeFi access and lower fees. It also… pic.twitter.com/Qe1IsJiXZp  — Dami-Defi (@DamiDefi) May 2, 2026  Heres what the top 10 privacy tokens actually shipped in Q1 2026, ranked by what mattered most for each project. Some delivered cryptographic leaps. Others closed major raises or shipped institutional partnerships.  A few posted double-digit weekly gains on the back of governance moves and protocol upgrades. The pattern across all of them is the same: privacy tokens spent Q1 building, not waiting.  ZEN, ZEC, and SCRT: Migration, Mobile Privacy, and AI Inference  Horizen ($ZEN) finished its migration to Base, Ethereums Layer 2. ZEN staking relaunched. The first Confidential Compute Environment went live for private on-chain app execution. The move unlocks better DeFi access and lower fees. ZEN staking relaunched alongside it. The first Confidential Compute Environment went live

05-03Industry

WIF Price Prediction: $0.15 Capitulation Within 14 Days After Brief Rally

The Rally That Isnt  WIF is bouncing at $0.19 with all the conviction of a dying fish. The token managed a pathetic 0.54% daily gain on volume that wouldnt move a penny stock, signaling this is relief rather than recovery. Price action shows WIF desperately clinging to its 7-day moving average after the brutal drop from $0.31 highs, but momentum indicators paint a picture of exhaustion rather than strength.  The RSI hovers near the midpoint with zero directional conviction, while MACD refuses to show any meaningful divergence. These aren‘t the conditions that spawn sustainable rallies – they’re the setup for the next leg down. WIF is consolidating in a narrowing range between $0.18 and $0.20, coiling like a spring before the inevitable snap lower.  Technical Breakdown Imminent  The chart reveals WIF‘s precarious position sitting 40% within its Bollinger Bands, suggesting ample room for further decline. Every meaningful moving average has collapsed toward current price levels except the 200-day SMA at $0.31 – a stark reminder of how far this token has fallen from grace. The distance between current price and that long-term average creates gravitational pull that’s impossible to ignore.  Support at $0.18 represents the last line of defense before open air down to $0.15.

05-03Industry

HBAR Price Prediction: Trapped at $0.09 - June Breakout or 30% Collapse

The Current Technical Picture  HBAR continues trading in a tight range around $0.09, creating a consolidation pattern thats reaching its breaking point. The token faces a critical juncture where multiple technical factors are converging to force a decisive directional move. With daily volume averaging just $4.7 million, liquidity remains thin and any significant order flow could trigger sharp price movement.  The RSI indicator sits at 44.59, positioning HBAR in neutral territory but with a slight bearish lean. More concerning is the MACD histogram flatlining at zero, indicating complete momentum exhaustion. This technical setup typically precedes volatile breakouts, though the direction depends on which side gains control first.  Critical Support and Resistance Levels  The $0.09 level has become both psychological support and resistance, with all major moving averages converging at this price point. The 200-day simple moving average sits significantly higher at $0.12, creating a 33% gap that represents major resistance for any bullish breakout attempt.  Bollinger Bands have compressed dramatically, with HBAR trading at just 30% of the normal band width. This compression pattern historically leads to explosive moves, but current market structure suggests higher probability of downside resolution. The next major support zone lies at $0.06, representing a 33% decline from current levels.  Market Dynamics

05-03Industry

PEPE Price Prediction: Neutral Zone Breakout or Extended Sideways Action Through June?

Technical Deadlock at Critical Juncture  PEPE finds itself in technical purgatory with RSI sitting at 58.38 – too high for oversold bounce plays, too low for overbought rejection setups. The Bollinger Band position at 0.75 indicates proximity to resistance rather than support, while daily volume of $26.1 million on Binance shows moderate institutional interest without the explosive participation that drove previous rallies.  The momentum picture tells a story of indecision. MACD histogram hovers near zero with bearish undertones suggesting underlying selling pressure, while Stochastic oscillators show %K at 56.36 and %D at 45.09 – a attempted bullish crossover that lacks conviction. This technical setup screams consolidation before the next directional move materializes.  Price Action in No-Mans Land  Without clear support and resistance levels printing in current data, PEPE operates in a technical void where traditional analysis breaks down. This absence of defined levels reflects the tokens current state – trapped between competing forces with neither bulls nor bears establishing dominance.  Hourly candlesticks (about 96 bars), same endpoint as our cryptocurrency price pages. Numbers below refresh from 1-minute klines.  Full PEPE price, calculator & analysis  The momentum divergence becomes apparent when examining the relationship between price stability and indicator behavior. While PEPE maintains relatively steady trading ranges, the

05-03Industry

AAVE Price Prediction: $80 Breakdown Imminent Before December Recovery to $120

AAVEs Critical Juncture  AAVE sits at $92.12 in a deteriorating technical position that‘s about to resolve violently. The token has rejected every attempt to reclaim meaningful resistance while bears systematically dismantled support levels. This isn’t consolidation – its controlled demolition ahead of a capitulation move.  The price action shows classic distribution patterns where smart money exits into retail strength. AAVEs position deep in the lower Bollinger Band territory signals oversold conditions, but oversold can become more oversold in bear markets. The momentum indicators paint a picture of sellers in complete control, with buying interest evaporating at current levels.  Market Structure Breakdown  Derivatives positioning reveals the harsh reality facing AAVE bulls. While large traders maintain 60% long exposure, the aggressive selling pressure shown in the taker ratios demonstrates institutional distribution. These aren‘t conviction longs – they’re trapped positions hoping for relief rallies that arent coming.  The futures market structure shows declining open interest alongside price weakness, indicating position closures rather than fresh shorting. This typically precedes acceleration moves as remaining weak hands get flushed out. Spot volumes remain anemic, suggesting retail has already capitulated while institutions continue methodical selling.  The Path Forward  AAVE faces an unavoidable test of $80 support within the next two weeks. The technical damage

05-03Industry

EGLD Technical Analysis May 2

EGLD is consolidating in a horizontal trend at the $4.13 level; with bearish signals below the short-term EMA20, RSI at neutral level (50.76), and MACD showing a negative histogram. While critical resistance around $4.20 awaits testing, BTC correlation presents a cautious outlook for altcoins.  Executive Summary  EGLD‘s technical chart shows a horizontal market structure as of May 2, 2026; the price is positioned below EMA20 ($4.14) at $4.13, under short-term bearish pressure. RSI at 50.76 is neutral, MACD gives bearish signals, while volume at low levels ($4.58M) confirms consolidation. Critical supports at $4.12 and $3.89, resistances concentrated in the $4.20-$4.56 band; BTC’s sideways trend and bearish Supertrend may limit altcoin rallies. Risk/reward ratio is balanced but breakdown risk is high – strategic wait-and-see recommendation dominates.  Market Structure and Trend StatusCurrent Trend Analysis  EGLD is maintaining a horizontal trend in the $4.04-$4.15 range with a slight 0.98% increase over the last 24 hours. On the daily timeframe, the price remains below EMA20 ($4.14), dominating a short-term bearish structure; the Supertrend indicator is in bearish mode and points to $4.72 resistance. On a weekly perspective, a broader consolidation is observed, with a total of 5 strong levels identified across 1D/3D/1W timeframes: 2 supports/3 resistances on 1D.

05-03Industry

LDO Price Prediction: Relief Rally to $0.44 Before $0.30 Collapse

Market Context: Why LDO is Moving Now  Lido DAO trades in a textbook distribution phase after getting crushed from $0.52 highs. The sideways grind around $0.37 reflects broader DeFi weakness, but liquid staking demand keeps institutional money flowing despite retail capitulation. Bulls and bears remain deadlocked in a battle that will resolve violently.  The 1.06% daily pump is meaningless noise within this larger consolidation. LDO sits 29% below its 200-day moving average – a breach this severe rarely reverses on first attempts. Analysts at Blockchain.news expect multiple false breakouts before any sustainable recovery begins.  Indicator Alignment  RSI at 50.97 shows zero momentum in either direction while MACD sits dead flat at the zero line. This neutral reading masks dangerous compression building beneath the surface. Bollinger Bands position LDO at 0.39 – low enough to suggest selling exhaustion but not oversold enough to guarantee a bounce.  The daily ATR of $0.03 reveals volatility has compressed to critical levels. When price action gets this quiet, explosive moves follow. The question isnt if LDO breaks out, but which direction it chooses.  Whales & Analyst Targets  Derivatives data exposes the real positioning behind LDOs sideways action. Retail traders pile into shorts with a 0.68 long/short ratio while smart money maintains near-balanced

05-03Industry

FTC Seeks $4.7 Billion Restitution from Alex Mashinsky

The American Federal Trade Commission (FTC) has ruled that former Celsius Network CEO Alex Mashinsky must pay $4.7 billion in compensation for losses stemming from Celsius‘s 2022 collapse. The decision, announced on Tuesday in the U.S. District Court for the Southern District of New York, bans Mashinsky for life from the crypto and financial services industries. Most of the ruling is suspended; Mashinsky is currently only required to pay $10 million. If he lies in his asset declaration or hides significant assets, the full amount will be collected. This development marks the closure of one of the crypto industry’s largest fraud cases.  Details of the FTCs $4.7 Billion Ruling Against Alex Mashinsky  Celsius was a platform that allowed users to deposit and lend cryptocurrencies; however, its 2022 bankruptcy resulted in billions of dollars in losses. The FTC‘s complaint highlights that Mashinsky and other Celsius executives marketed these services misleadingly and deceived consumers. The ruling places the $4.7 billion liability remaining from Celsius’s bankruptcy directly on Mashinsky; it also imposes reporting and record-keeping requirements for up to 18 years. Mashinsky pleaded guilty in December 2024 to commodity fraud and manipulating the price of Celsiuss CEL token, receiving a 12-year prison sentence. Institutions such

05-03Industry

Feds Goolsbee highlights inflation concerns amid internal Fed disagreements

## Market Snapshot  Dissent at April Fed Meeting market currently shows uncertainty regarding dissents, with no clear pricing trend. Fed Decision June and July market indicates a 3.9% probability of a rate decrease, reflecting a slight decline from previous pricing. Bitcoin Price Above on May 2 market is largely unaffected, remaining at 99.9% YES.  ## Key Takeaways  – Goolsbees comments suggest internal Fed disagreements, consistent with potential dissent at the April meeting. – Remarks imply persistent inflation concerns, suggesting reduced likelihood of a rate cut in June or July. – Current geopolitical tensions and inflation data appear to have minimal impact on Bitcoin pricing.  ## Article Body  Austan Goolsbee, President of the Federal Reserve Bank of Chicago, expressed concerns about recent inflation data, describing it as unfavorable. He highlighted issues with services inflation, which he noted is not primarily driven by oil prices. This comes amid geopolitical tensions, particularly Iran‘s closure of the Strait of Hormuz, which has significantly raised energy prices. The conflict has complicated the Federal Reserve’s forward guidance, with officials divided on the trajectory of interest rates. Some Fed members, like Dallas Fed President Lorie Logan, have dissented from language suggesting future rate cuts, citing uncertainties surrounding the inflation outlook and its

05-03Industry
1
...
788790
...
1000