Solana Price Prediction: Polymarket Prices $90 At 70% As Ethereum Money Moves In 

SOL trades at $85.64, up 2.06%, pushing toward the 0.382 Fib at $84.74 with the 50-day EMA at $86.21 as the next resistance.Polymarket gives 70% odds SOL hits $90 in May, 24% for $100, with 64% pricing a $80 close as the most consensus downside.Solana pulled $381M in ecosystem inflows over three months with 69% sourced from Ethereum, per Artemis data.  Solana trades at $85.64 on May 4, up 2%, with Polymarkets monthly market pricing 70% odds of a $90 close in May and on-chain data showing $381M in ecosystem inflows over the past three months, 69% of which came from Ethereum.  SOL Daily Chart: Fibonacci Resistance Stacks Up At $86 To $90  The Fibonacci retracement runs from the cycle low at $76.73 to the swing high at $97.69. SOL has been working through those levels since the March peak and is currently sitting between the 0.382 at $84.74 and the 0.5 at $87.21, with todays session pushing into that range. The 50-day EMA at $86.21 sits inside the same zone, making $84.74 to $87.21 the immediate decision range.  The descending trendline from the March high runs through the $87 to $88 area, adding a third layer of resistance to the 0.5 Fib and

05-04Ethereum

Ethereum Price Prediction: $2.5K Wall Blocks $4.9K Target

Ethereum is trying to build a long term recovery pattern, but the $2,400 to $2,500 resistance zone is still blocking momentum. A breakout above that area could reopen the path toward $2,800 first, while the larger chart still points to $4,900 as the major target.  Ethereum Eyes $4,900 Resistance as Chart Shows Possible Bottom Pattern  Ethereum traded near $2,303 on the weekly ETH/USDT chart shared by Ray, while price continued to recover from the trendline support area.  The chart shows ETH holding above a long rising support line that has guided major lows since 2020. Ethereum recently bounced from the same trendline area, forming what the chart labels as the “Head” in a possible inverse head and shoulders setup.  Ethereum Inverse Head and Shoulders Chart: Source:  The left shoulder formed after ETH dropped from the 2025 high area and recovered near the mid range. The head formed later, when price fell deeper toward the rising support line before rebounding. The chart now marks a possible right shoulder as ETH trades around the $2,300 area.  This structure matters because an inverse head and shoulders pattern can show a possible trend reversal. However, the setup remains incomplete until ETH breaks above the neckline area. On this chart, that

05-04Ethereum

Ripple CTO Emeritus on ETH Decision: Even 1% Chance Would Have Changed Everything

In a recent discussion on X, Ripple CTO Emeritus David Schwartz reflected on his early Ethereum exit. An X user had retold Schwartz‘s story of selling his ETH holdings for $1.05 each and that the Ripple CTO Emeritus wouldn’t have sold if he thought there was a 1% chance of ETH hitting $2,368.  Schwartz famously sold a total of 40,000 ETH when the second largest cryptocurrency was trading at just $1.05. The Ripple CTO Emeritus initially bought the 40,000 ETH tokens at $0.311 and sold because he thought the token had reached its top. The proceeds were used to purchase a set of solar panels that he installed at his home in Oakland, California. Shortly after this, the ETH price started rising.  In response to the X user, Schwartz responded that a 1% chance of his knowing the ETH price would rise might have made a difference and he would not have sold it for $1.05. To him, the odds of ETH reaching $2,368 werent just there.  Crypto Regulation 2026: What Is Happening in Russia?  Bitcoin Might Never Trade Below $60K Again  If I had thought there was a 1% chance of it hitting $2,368, I would not have sold it for $1.05. Im still

05-04Ethereum

XRP News: Ripple Ex-CTO Shares Reality Check On XRP Ledgers 1500 TPS Speed

David Schwartz, former CTO of Ripple, sparked XRP news headlines as he provided a reality check on widely quoted performance claims of the XRP Ledger. He especially remarked on the networks theoretical 1,500 transactions per second (TPS) capacity.  XRP News: Ripple CTO Emeritus Clears The Air On XRPL Speed  He responded to Banaxchange media platform‘s questions regarding the XRP Ledger’s speed. His comments led to another wave of community discussions after previously dismissing ‘secret plan’ claims around Ripple.  Schwartz clarified that the network‘s architecture doesn’t provide a strict limit to the number of transactions that can be submitted at a time.  “There really is no limit to the number that could be handled at once because they could be distributed throughout the various nodes running the software and percolate to the validators over time,” he said.  However, he stressed, this does not map to instant scale processing. With a hypothetical scenario, Schwartz mentioned that “someone dumping, say, a million transactions on the network at once” would take a long time before all the transactions could be confirmed.  In the XRP news today, Schwartz also wrote about the frequently-quoted 1,500 TPS benchmark. He described it as a capability under ideal or “realistic conditions.” On the contrary, he

05-04Industry

Ripple XRP Price Zooms Above $1.40 on Rising Volume: Further Breakout Coming?

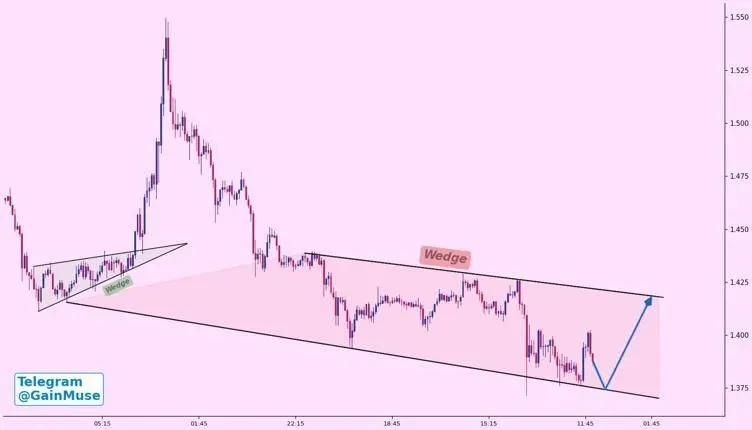
Ripple XRP pushed back above $1.40 during early Asia hours, trading near $1.41–$1.42, up roughly 0.50% in 24 hours from intraday lows around $1.37, as a sharp volume surge raised the immediate question of whether bulls can sustain the reclaim.  The move matters precisely because $1.40 had capped multiple upside attempts in recent sessions, making its breach something traders will watch closely on any pullback. What happens at this level over the next 24–48 hours could define XRPs near-term trajectory.  The breakout unfolded as Bitcoin climbed during the same window, lifting broader risk sentiment across crypto markets and providing a tailwind for altcoin positioning. Volume spiked approximately 13%, driving XRP from a low near $1.38 to a session high around $1.42, with price accelerating cleanly through the $1.3990 resistance zone in the final hour of the move.  Binance futures data showed takers buying 372M XRP against 372.1M sold, suggesting real directional positioning rather than a low-liquidity drift higher.  Source: Coinglass  Price is currently consolidating near $1.4040–$1.4060, holding just above the breakout zone, but the structure of the move, not just the price level, is what sets up the analysis below.  DISCOVER: Next Crypto to Explode in 2026  Can Ripple XRP Price Reach $1.50 This Week?  XRPs 24-hour price

05-04Industry

Elon Musk eyes $10 trillion net worth ahead of SpaceX IPO

Elon Musk is talking about a $10 trillion fortune while Wall Street is already making room for SpaceX before its expected IPO.  Speaking on X, Elon answered Peter H. Diamandis, the founder of the XPrize Foundation, after Peter said Elon had crossed about $800 billion, or around 2.7% of the entire U.S. GDP. Elon wrote, “$10T or bust.” Peter tied the size of that wealth to John D. Rockefeller in 1913 and said, “Rockefeller had oil. Elon has the future.”  The bigger story is the money chase around SpaceX, the private rocket and satellite company that could list at around $1.5 trillion.  Nearly 200 institutional investors from major Wall Street funds recently traveled to Texas for a SpaceX pitch, some fund managers have already set aside money for SpaceX, deciding how much they can buy, and looking at what they may need to sell. Some are weighing cuts to big tech positions, including Tesla (TSLA), to free up cash.  Retail traders are watching the Tesla (TSLA) side while all this plays out. On Stocktwits, sentiment around TSLA was listed as extremely bullish, though message volume was low. SpaceX sentiment sat at bearish, with extremely low chatter.  One Stocktwits user asked, “For real tho, why doesnt

05-04Industry

Solana Price Prediction: $100 Curse Deepens as SOL/BTC Bleeds

Solana remains stuck below $100 after 88 straight days, marking its longest weak stretch since 2020. At the same time, the SOL/BTC chart shows Solana still losing strength against Bitcoin, with no confirmed reversal yet.  SOL Bleeds Against Bitcoin as Chart Points to Possible Lower Support Test  Solana continues to weaken against Bitcoin, according to the weekly SOL/BTC chart shared by Crypto Moe. The chart shows SOL/BTC moving lower inside a broad downtrend after failing to hold its 2024 strength.  SOL currently trades near the lower part of the chart, while the blue curved resistance line still caps the broader structure. That line shows SOL losing relative strength against BTC since its previous high area. Each recovery attempt has stayed below that curve, keeping pressure on the pair.  SOL/BTC Relative Weakness Chart. Source:  The chart also marks a possible lower support area near the green zone. Crypto Moe pointed to that area with the note “maybe here,” suggesting SOL/BTC may need another drop before a stronger reaction starts. That zone sits below the current price and lines up with an earlier base from the 2023 consolidation range.  This means SOL can still rise in dollar terms if Bitcoin moves higher. However, the chart suggests SOL may

05-04Industry

AVAX Stabilizes, SOL Fights Pressure, and BlockDAG’s Upcoming Layer-1 Casino Launch Fuels $1 Forecasts!

The crypto market rarely hands you clear signals, but right now, three names are flashing breakout potential. The Avalanche price prediction 2026 is flashing cautious optimism as AVAX holds firm at the $9 support level. The Solana price today tells a similar story, with SOL hovering near the critical $80 mark. Both coins are at make-or-break levels, and the next move could set the tone for the months ahead.  Then there is BlockDAG, which is gaining popularity among those seeking the top crypto to buy for the next bull run. Its casino launching on May 7 switches on real, structural utility for BDAG, and analysts believe it will permanently rewire demand for the token, with forecasts pointing to a surge to $1 this year!  This utility is accompanied by live infrastructure capable of 10,000+ TPS, over $1B transferred in on-chain value, and Tier-1 listings on the horizon. Heres a breakdown of which is the best pick for most portfolios today.  Avalanche Price Prediction 2026: Key Levels to Watch   The Avalanche price prediction 2026 is heating up as AVAX is hovering around the $9 level, a key support where buyers are actively preventing further drops. The price is moving slowly upward within a tight

05-04Industry

Gold Price Forecast: XAU/USD accelerates reversal, bears aim for $4,500 area

XAU/USD maintains a bearish near-term bias from mid-April highs, with technical indicators on the 4-hour chart endorsing the negative view. A softer Relative Strength Index (RSI) near 36 and a Moving Average Convergence Divergence (MACD) reading, slipping into negative territory, hint that downside momentum is still dominating rebounds.  Bears are aiming for the support area between the April 29 low, at $4,510, and the late March lows right below $4,500. Further down, the March 26 low at the $4,350 area, and the March 23 low near $4,100 emerge as the next likely target.  Upside attempts, on the other hand, are likely to be tested at Fridays high of $4,660, ahead of the mentioned mid-April highs, below $4,900.  Gold FAQs  Gold has played a key role in human‘s history as it has been widely used as a store of value and medium of exchange. Currently, apart from its shine and usage for jewelry, the precious metal is widely seen as a safe-haven asset, meaning that it is considered a good investment during turbulent times. Gold is also widely seen as a hedge against inflation and against depreciating currencies as it doesn’t rely on any specific issuer or government.  Gold has an inverse correlation with the US

05-04Industry

Ripple CTO Emeritus on ETH Decision: Even 1% Chance Would Have Changed Everything

In a recent discussion on X, Ripple CTO Emeritus David Schwartz reflected on his early Ethereum exit. An X user had retold Schwartz‘s story of selling his ETH holdings for $1.05 each and that the Ripple CTO Emeritus wouldn’t have sold if he thought there was a 1% chance of ETH hitting $2,368.  Schwartz famously sold a total of 40,000 ETH when the second largest cryptocurrency was trading at just $1.05. The Ripple CTO Emeritus initially bought the 40,000 ETH tokens at $0.311 and sold because he thought the token had reached its top. The proceeds were used to purchase a set of solar panels that he installed at his home in Oakland, California. Shortly after this, the ETH price started rising.  In response to the X user, Schwartz responded that a 1% chance of his knowing the ETH price would rise might have made a difference and he would not have sold it for $1.05. To him, the odds of ETH reaching $2,368 werent just there.  Crypto Regulation 2026: What Is Happening in Russia?  Bitcoin Might Never Trade Below $60K Again  If I had thought there was a 1% chance of it hitting $2,368, I would not have sold it for $1.05. Im still

05-04Industry
1
...
762764
...
1000