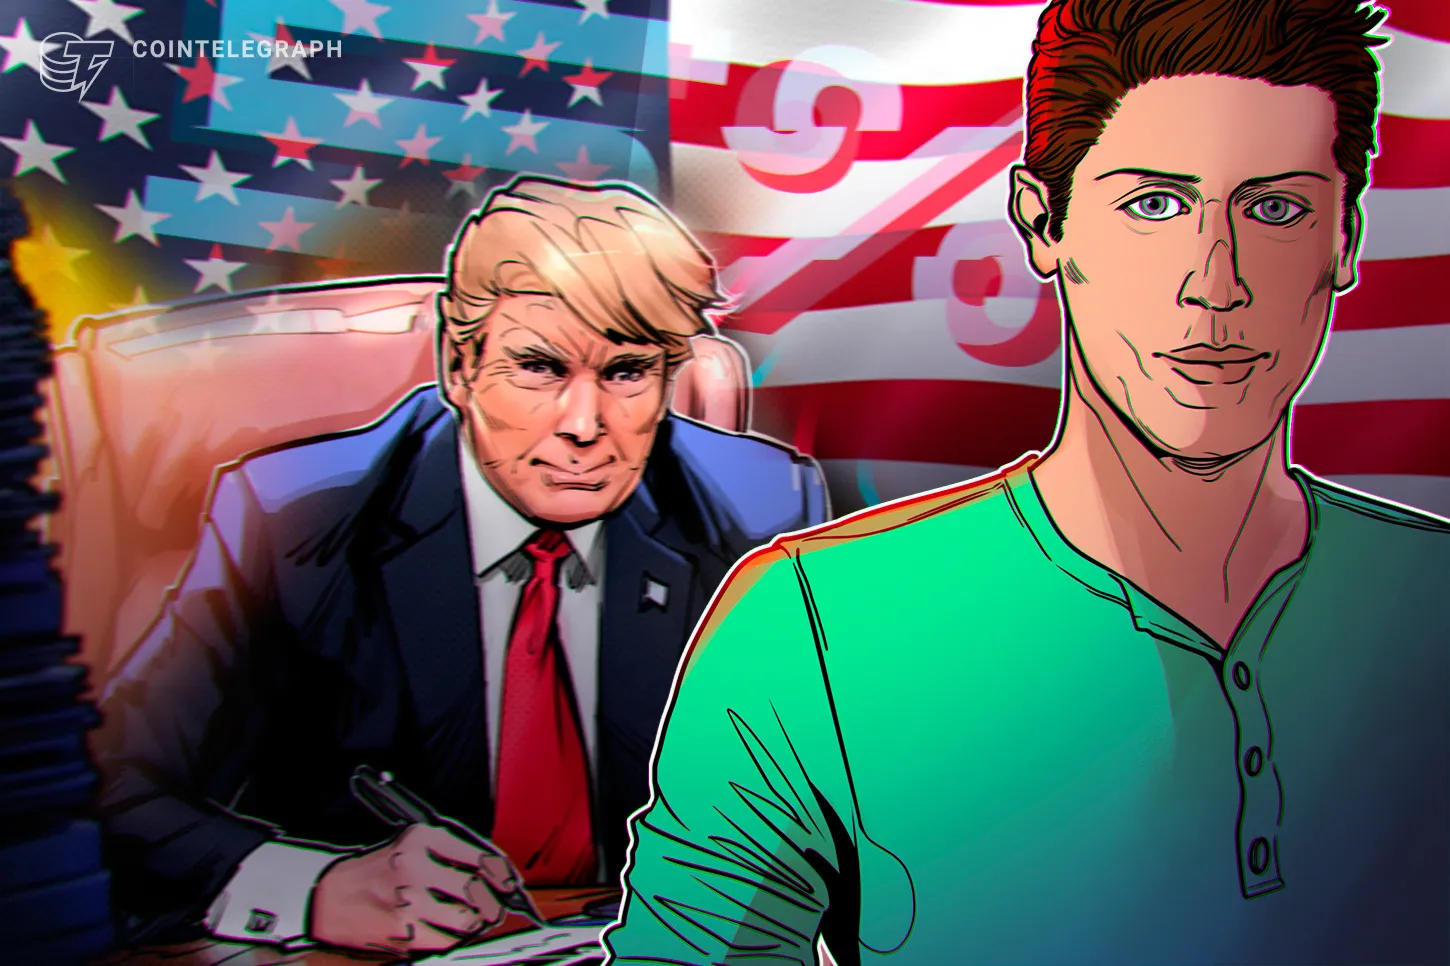
OpenAI weighs 5% stake for US government amid Trump talks: FT
OpenAI, the company behind ChatGPT, has reportedly discussed giving the US government a 5% equity stake as artificial intelligence oversight in Washington intensifies. The company raised the idea in early discussions with the Trump administration as it seeks to navigate a tougher political environment ahead of a potential public listing, the Financial Times reported on Thursday, citing people familiar with the matter. OpenAI CEO Sam Altman argued that giving the public a financial stake in the company would be the best way to share the economic benefits of the booming AI industry. The report comes weeks after OpenAI announced it had confidentially submitted an S-1 for a US initial public offering, joining Anthropic in preparing for a Wall Street debut this year. It also comes as the US government takes a more active role in overseeing advanced AI models. Proposal extends to other AI companies The proposal would see several leading US AI companies contribute a 5% equity stake to a public investment vehicle. However, it remains unclear whether companies such as Anthropic, Google and Meta would support the idea. The Financial Times reported that Altman modeled the proposal on Alaskas Permanent Fund, which invests the states oil revenue into stocks and pays dividends to residents.