Ambarella, Inc. stock Analysis: July Surge & M&A Catalyst Impact
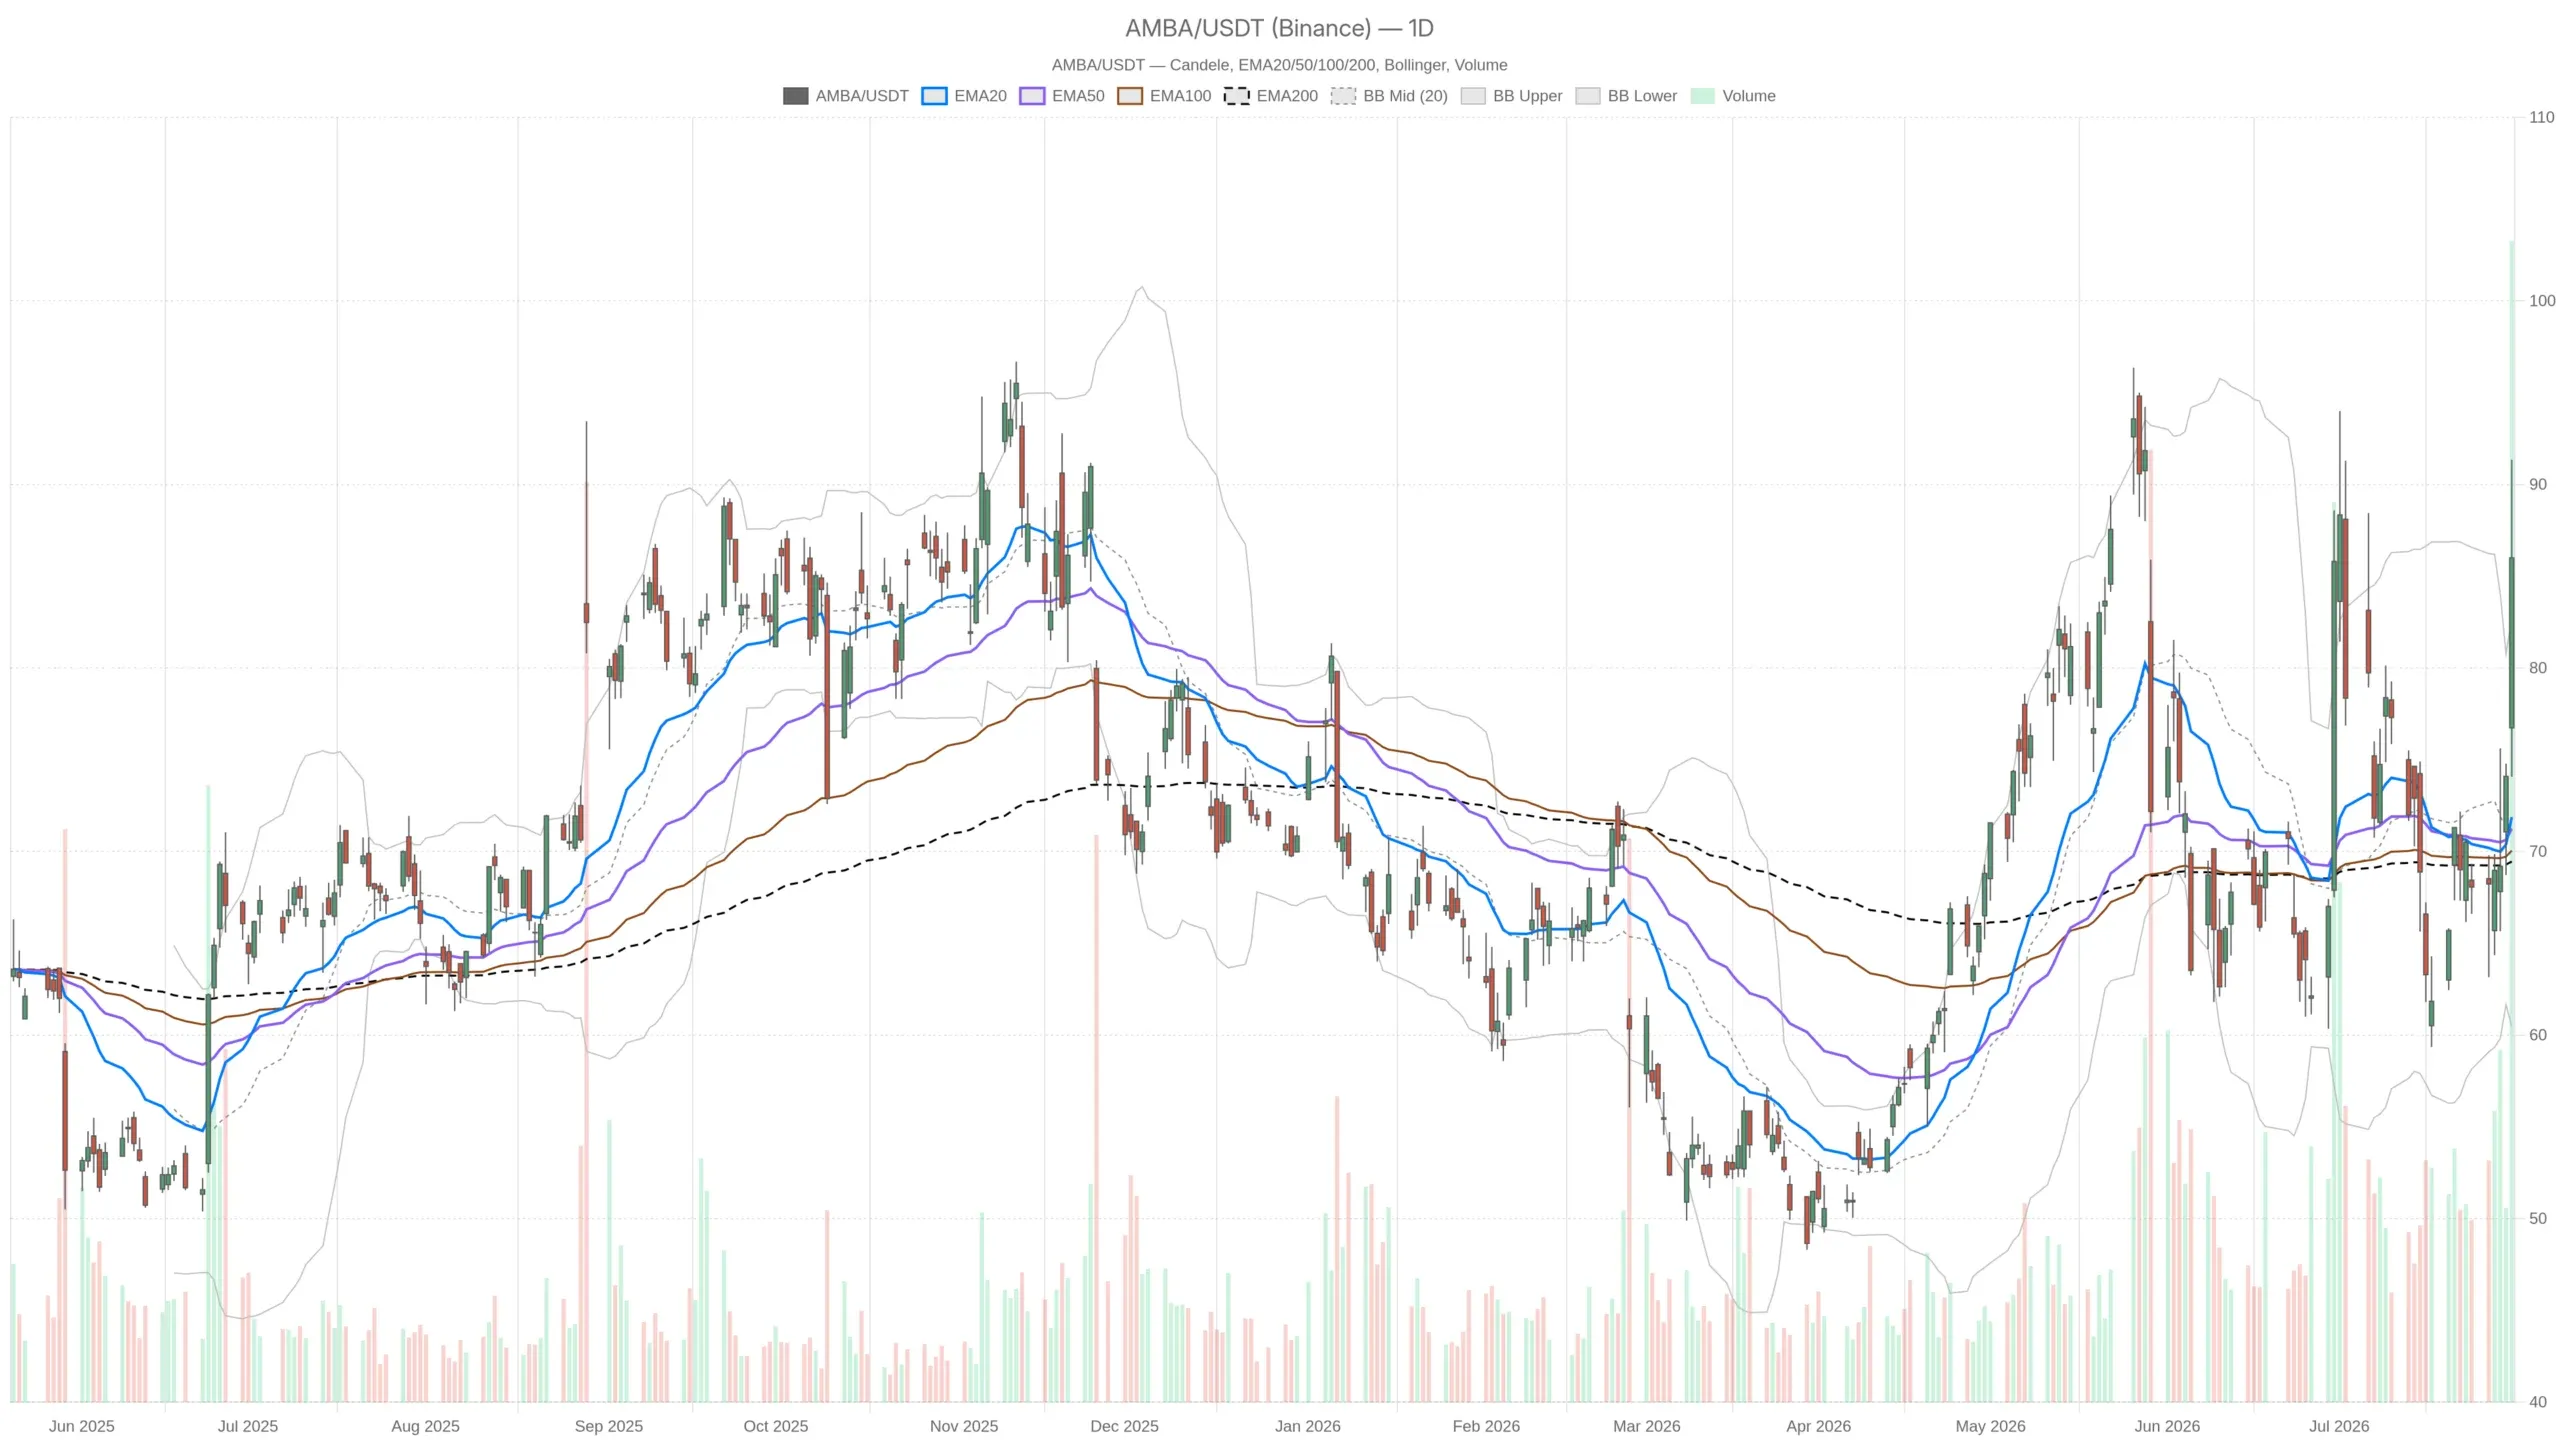
AMBA — daily chart with candlesticks, EMA20/EMA50 and volume.Ambarella, Inc. Stock Breaks Out as M&A Catalyst Meets Bullish Structure Ambarella, Inc. stock surged decisively on July 31, closing at $86.00 after hitting an intraday high of $91.34. Reports of acquisition talks with NXP Semiconductorssparked the move on heavy volume exceeding 9 million shares. The technical structure, already constructive, now aligns with a powerful narrative. Key takeawaysAmbarella, Inc. stock closed at $86.00on July 31, fueled by reports of acquisition talks with NXP Semiconductors.Daily EMAs are stacked bullishly — EMA20 at $71.87, EMA50 at $71.25, and EMA200 at $69.45 — confirming broad trend participation.The daily RSIat 64.54 confirms momentum without triggering overbought conditions, while the MACD crossover signals a meaningful shift.The 1H RSI at 74.55 is in overbought territory, suggesting the intraday move may need consolidation before further upside.A daily close below $76.27 would invalidate the bullish breakout and point to a retracement toward pre-spike levels near $74–$76. Daily Timeframe: Is Ambarella, Inc. Stock in a Bullish Regime? Yes. The daily chart confirms a clean bullish regime for Ambarella, Inc. stock, with momentum building well before Thursdays surge. All three key exponential moving averages sit stacked in bullish order beneath the price. Notably, the EMA20at $71.87, EMA50