It's Nvidia Day: Watch the biggest company on earth report earning live at the bell

13:00  Nvidia needs more than another beat as Wall Street raises the bar ahead of earnings  Nvidia (NASDAQ: NVDA) heads into Wednesdays after-hours report with a problem most companies would happily take: it has performed so well that simply delivering another strong quarter is no longer enough.  Despite clearing or beating Wall Street‘s key markers of earnings, sales, and guidance for the past four quarters in a row, shares of the world’s biggest company ended down the next day after each report.  The one and only weakness of this run was the second quarter from last year, where Nvidias forecast met the consensus estimates rather than topping them.  That pattern of results has changed how analysts perceive the forecasts of the firm. To put it simply, a positive-looking estimate can fall short despite being favorable if Wall Street believes the actual number will be even better in the end.  That task is even harder to perform because Nvidia is responsible for a large portion of the AI investment boom all over the globe right now. The firm is not only the leading provider of the needed hardware but plays an increasing financial role in the whole ecosystem as well.  For the second quarter, analysts tracked by FactSet

08-26Industry

Tokenized deposits could raise borrowing costs, Fed economists warn

Tokenized deposits could reduce U.S. banks capacity to hold long-term interest-rate exposure by $700 billion under one modeled scenario, according to research published Aug. 25 by Dallas Fed economists Rosie Levy and Srini Ramaswamy.  SummaryDallas economists estimate 10% greater rate sensitivity could reduce banks duration capacity by $700 billion.A 10% shorter deposit life could reduce maturity transformation capacity by approximately $580 billion systemwide.The estimates measure ten-year equivalent interest-rate exposure, not deposits predicted to leave banking institutions directly.Tokenization may let depositors and AI agents move funds instantly toward banks offering higher yields.Banks could respond with higher deposit rates, larger liquidity buffers or additional wholesale debt issuance.  The figure does not represent $700 billion of deposits expected to leave banks or an equivalent guaranteed decline in lending. It measures a possible reduction in banks duration risk appetite, expressed as the equivalent exposure to ten-year Treasury securities.  The authors also stated that their views should not be attributed to the Federal Reserve Bank of Dallas or the Federal Reserve System.  You might also like:  What is a tokenized deposit? Bank money goes on-chain  Tokenized deposits could make bank funding less stable  Tokenized deposits are ordinary commercial bank deposits represented on a blockchain or another distributed ledger. They can support automated

08-26Industry

Shipyard winds down IPFS work after Protocol Labs ends funding

InterPlanetary File System (IPFS) maintainer Shipyard will wind down its engineering, maintenance and infrastructure operations on Sept. 30 after Protocol Labs declined to renew its funding.  The funding loss will leave projects including Kubo, Helia, Boxo, Rainbow, IPFS Desktop and IPFS Companion without dedicated maintainers, Shipyard said in a Monday blog post.  IPFS is an open-source protocol for storing and sharing data across peer-to-peer networks. Protocol Labs is a research and development organization that created IPFS and Filecoin, a blockchain network designed to incentivize decentralized data storage.  The engineering collective will cease operating public infrastructure, including ipfs.io, dweb.link, delegated-ipfs.dev and the IPFS bootstrap nodes. Protocol Labs owns the associated domains and infrastructure and will determine their future, according to Shipyard.  IPFS itself is not shutting down, but Shipyards wind-down removes dedicated stewardship from many popular implementations and services unless other maintainers take them over.  Protocol Labs engineering and research lead Molly Mackinlay said in an online forum discussion that IPFS would shift to “lighter-weight stewardship” through IPFS Foundation grants to individual maintainers. She added that development would continue on decentralized public infrastructure.  Shipyard was established in 2024 as an independent collective of longtime IPFS developers who previously worked at Protocol Labs.  Related: BNB Chain activates Pasteur hard

08-26Industry

Supply absorption ‘key question’ as Bitcoin fails to reclaim $80K: Analysis

Bitcoin (BTC) remains sensitive to sell-side pressure at $80,000, even as investors broadly avoid mass profit-taking.  Key points:Bitcoin investors unrealized profit and loss crosses above zero for all cohorts, apparently slowing price momentum.Long-term holders see a spike in profitability to 1.48, while short-term holders still account for the majority of in-profit coins moving onchain.The Coinbase premium fails to return to positive territory at -0.015, underscoring lackluster US demand.  Older Bitcoin investors reactivate around 14-week highs  Data from onchain analytics platform CryptoQuant reveals that older coins in particular moved onchain as BTC/USD gained more than 25% over the past week.  The spent output profit ratio (SOPR), which is the ratio of the current value of recently spent UTXOs to their value at creation, ticked up to 1.48 on Aug. 22, indicating increased onchain activity involving in-profit coins.  Bitcoin LTH-SOPR. Source: CryptoQuant  As price consolidated around $79,500, the so-called SOPR ratio, which divides the SOPR of short-term holders (STH) by that of long-term holders (LTHs), hit 1.4, its highest reading since July 25. STH and LTH refer to wallets that hold BTC without selling for up to six months (STH) or longer than six months (LTH).  “This suggests long-term holders were realizing profits at a higher relative rate than

08-26Industry

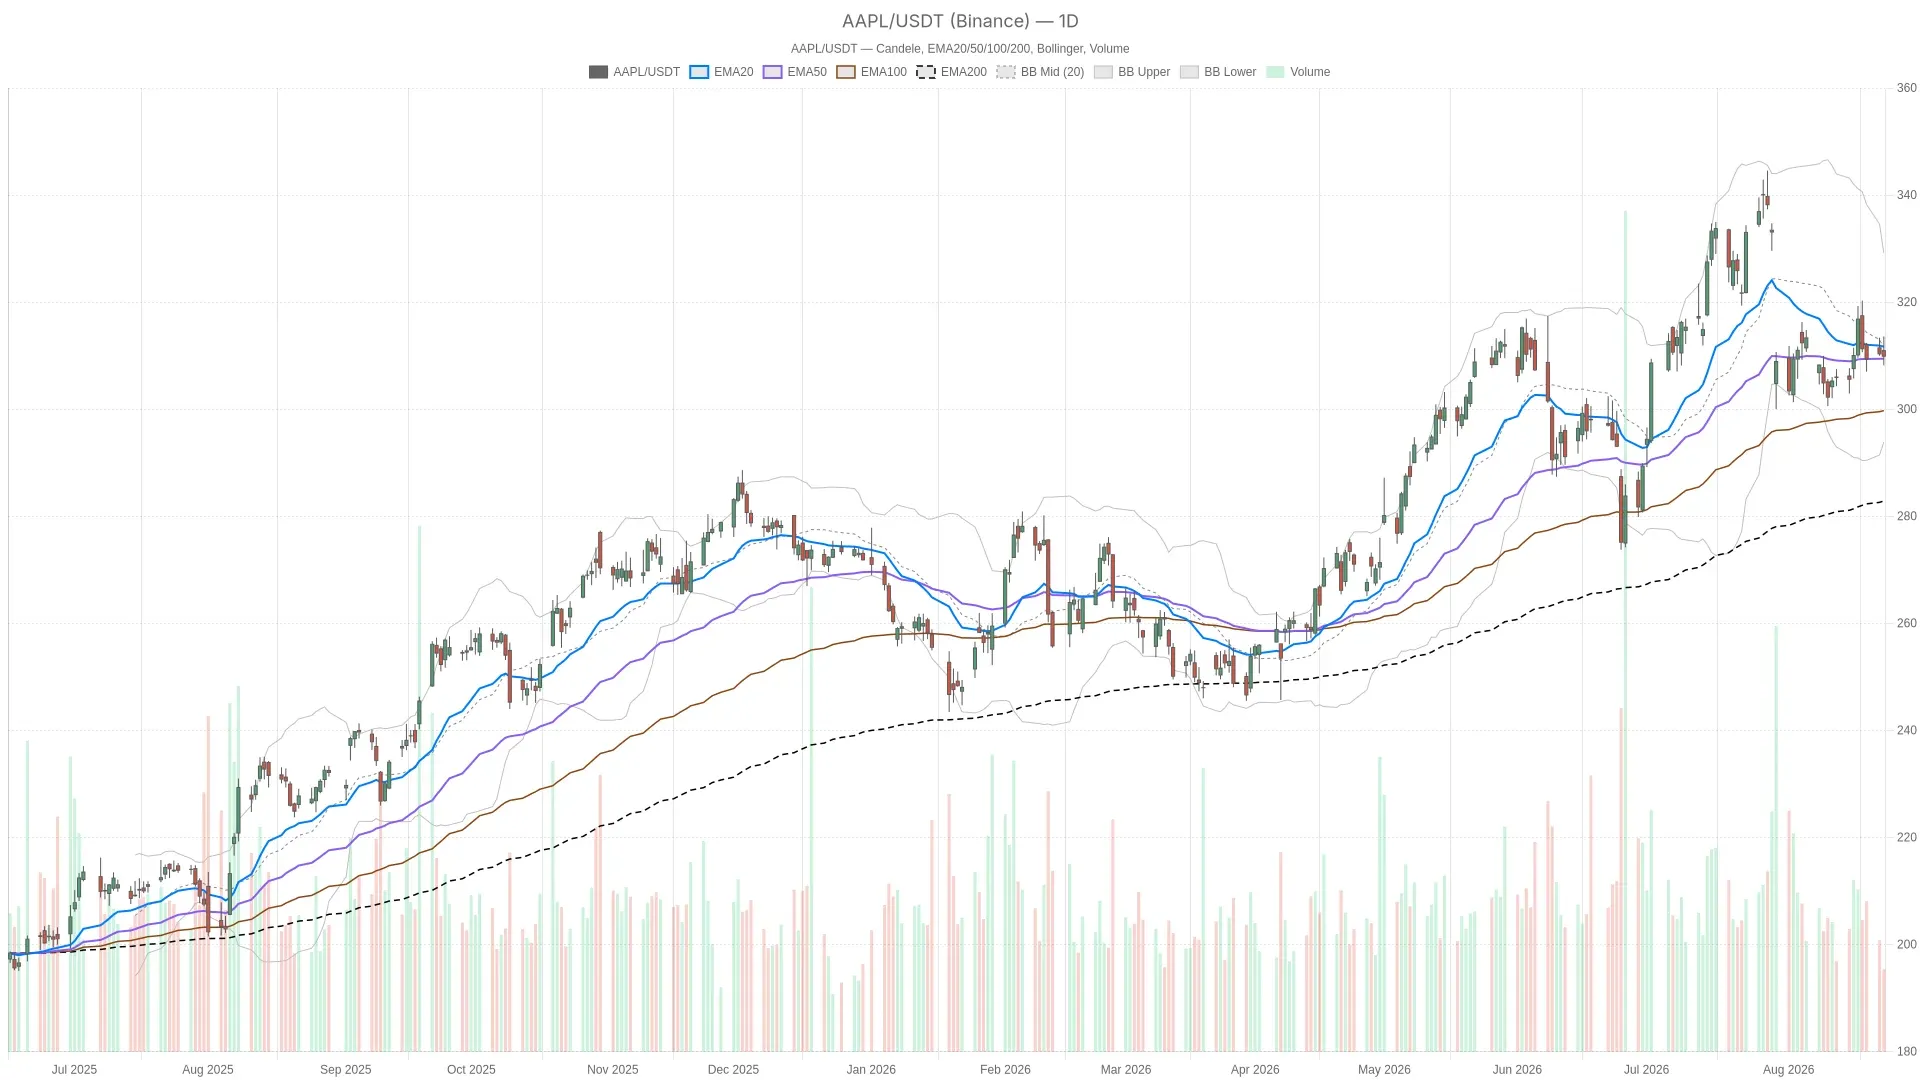
Apple Stock Analysis Near $310: Neutral Momentum Tests Bulls

Apple Stock (AAPL) is trading in a tight, indecisive band just above $309, pausing after a pullback from its 52-week high. The last session closed at $309.90, ranging between $308.21 and $313.58. Price sits at the intersection of the 20-day and 50-day EMAs, $311.69 and $309.44.  AAPL — daily chart with candlesticks, EMA20/EMA50 and volume.Key takeawaysApple stock closed at $309.90, ranging between $308.21 and $313.58 in a neutral consolidation above $309.The 200-day EMA at $282.87keeps the longer-term uptrend structurally intact.Daily RSI14 reads 47.82, while the daily MACD histogram sits at -0.15, signaling fading downside momentum.The hourly MACD histogram has widened to -0.21, showing short-term selling pressure that has not exhausted.Daily support at $307.55and resistance at $312.92frame the near-term battleground.  Apple Stock Daily Chart: Uptrend Intact but Momentum Cooling  The daily chart keeps Apple stock in a longer-term uptrend, but short-term momentum is cooling. The 200-day EMA sits far below current price at $282.87. Therefore, the broader trend that has carried Apple stock higher over the past year remains structurally intact.  Momentum and volatility are neutral  However, the short-term momentum picture is far less convincing. Daily RSI14 reads 47.82, a neutral reading. It shows neither overbought excess nor oversold panic, just a market pausing.  The MACD adds

08-26Industry

TON Price Prediction: Dead Cat or Coiled Spring? $1.57 Is the Line in the Sand

James Ding  Aug 26, 2026 08:44  TON is trading at $1.60 with momentum sitting at a knife-edge inflection — a MACD histogram pinned at zero screams decision time. Hold $1.57 and bulls can gun for $1.67–$1.75 over the next two week…  TONs Technical Reality Check  Lets be blunt: TON is trapped in a bear compression zone, and the charts are sending a very specific warning to anyone not paying attention. Price at $1.60 sits below every meaningful moving average except the 200-day SMA at $1.55 — which, for now, is acting as the gravitational floor. The SMA 50 at $1.78 and SMA 20 at $1.64 are both stacked overhead like a descending ceiling, confirming the broader trend is still down from prior highs.  But here‘s where it gets interesting. The MACD histogram has flatlined at exactly zero — both the MACD and Signal lines converging at -0.0491. That’s not weakness; thats a coiled spring. When histogram momentum crosses from negative to positive, even fractionally, it typically signals early institutional re-accumulation. Meanwhile, the Stochastic is quietly flashing a potential bullish crossover, with %K at 37 printing above %D at 29 — the kind of setup that precedes short-squeeze bounces in low-liquidity alts. The Bollinger %B at

08-26Industry

Ripple price today Analysis: Near-Term Pullback Amid Bullish Trend

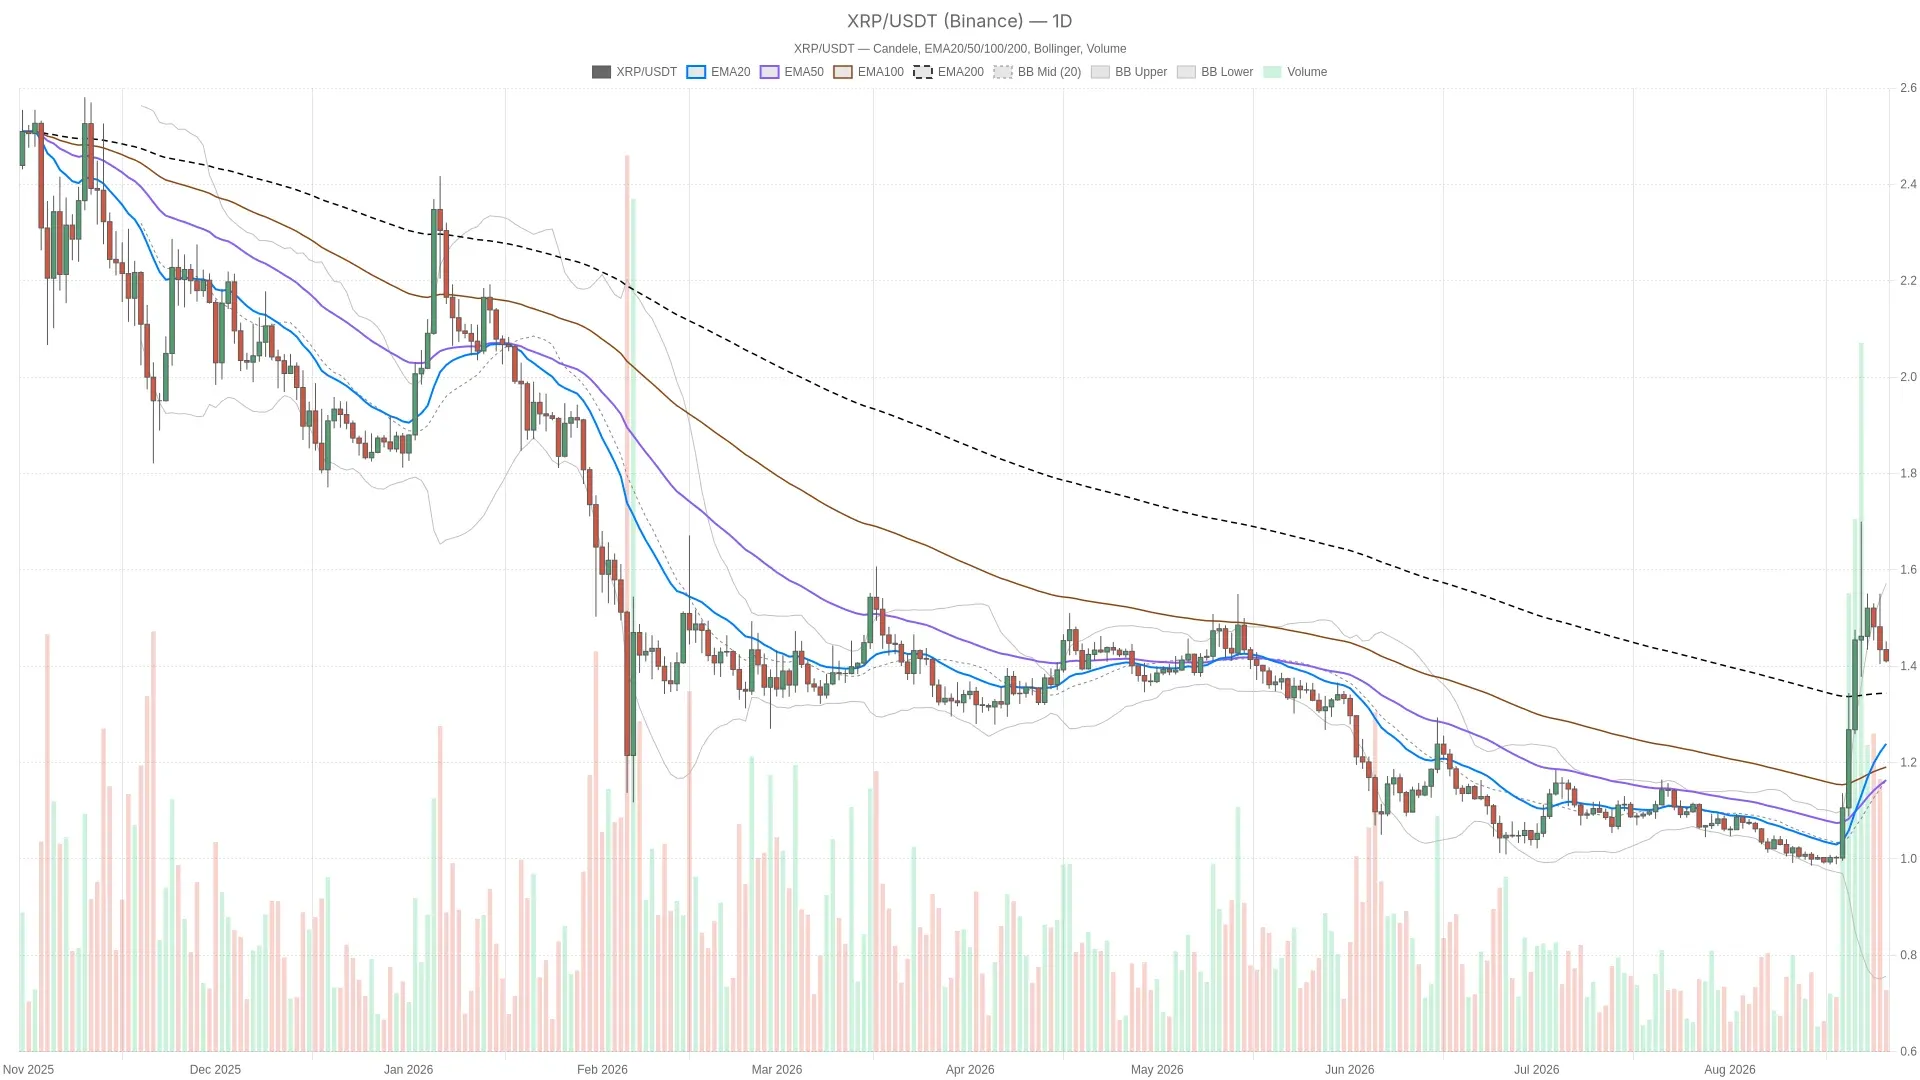
As of August 26, 2026, the Ripple price today sits at $1.41, caught between a daily chart that still leans bullish and hourly charts that are flashing clear signs of fatigue. This is the kind of setup where the higher timeframe tells you one story and the lower timeframes tell you another, and figuring out which one prevails over the next few sessions is really the whole game right now.  XRP/USDT — daily chart with candlesticks, EMA20/EMA50 and volume.Key takeawaysXRP trades at $1.41on August 26, 2026, above all major daily EMAs but below key hourly moving averages, signaling a short-term pullback inside a broader uptrend.Daily RSI14 sits at 70.67in overbought territory, while hourly RSI14 has dropped to 30.23, creating a sharp divergence between the two timeframes.Total crypto market capitalization is down 3.48%in the past 24 hours, with Bitcoin dominance climbing to 59.23%, suggesting capital rotation away from altcoins.The Fear & Greed Index remains at 65(Greed), creating a notable mismatch between sentiment and the ongoing pullback.The $1.40–$1.45zone is the critical decision area — a break above or below it will likely determine the next directional move.  The backdrop isn‘t helping altcoins make an easy case for themselves. Total crypto market capitalization is down

08-26Industry

SHIB Price Prediction: Post-Bounce Trap or Launchpad to $0.0000067 — Here's the Trade

Tony Kim  Aug 26, 2026 08:38  SHIB is clinging to $0.0000053 after a vicious -3.98% intraday flush, momentum sitting uncomfortably mid-range while Bitcoins own post-surge consolidation below $79K threatens to yank the rug on e…  Market Context: Why SHIB is Moving Now  Let‘s be direct: SHIB didn’t rally 30% this week on its own merit. It piggybacked on Bitcoin‘s best August since 2017 — a +26% monthly surge fueled by U.S. Treasury bond buyback announcements, a relentless $3+ billion wave of spot Bitcoin ETF inflows, and a short squeeze that torched over $211 million in BTC short positions. When Bitcoin rallies that hard, meme coins don’t walk — they sprint. The Fear now it needs to consolidate or risk a snap back to the mid-band.  From a key levels standpoint: $0.0000049 (immediate support) and $0.0000043 (strong support) define the downside map. On the upside, $0.0000067 is the first meaningful resistance, with $0.0000078 as the stretch target for bulls. The current $0.0000053 print is sitting in no-mans land between those poles.  Whales & Analyst Targets: What Is Smart Money Preparing For?  The on-chain data is sending a bifurcated signal. On the bullish side: 811 billion SHIB net outflowed from exchanges in recent sessions — that‘s a classic accumulation

08-26Industry

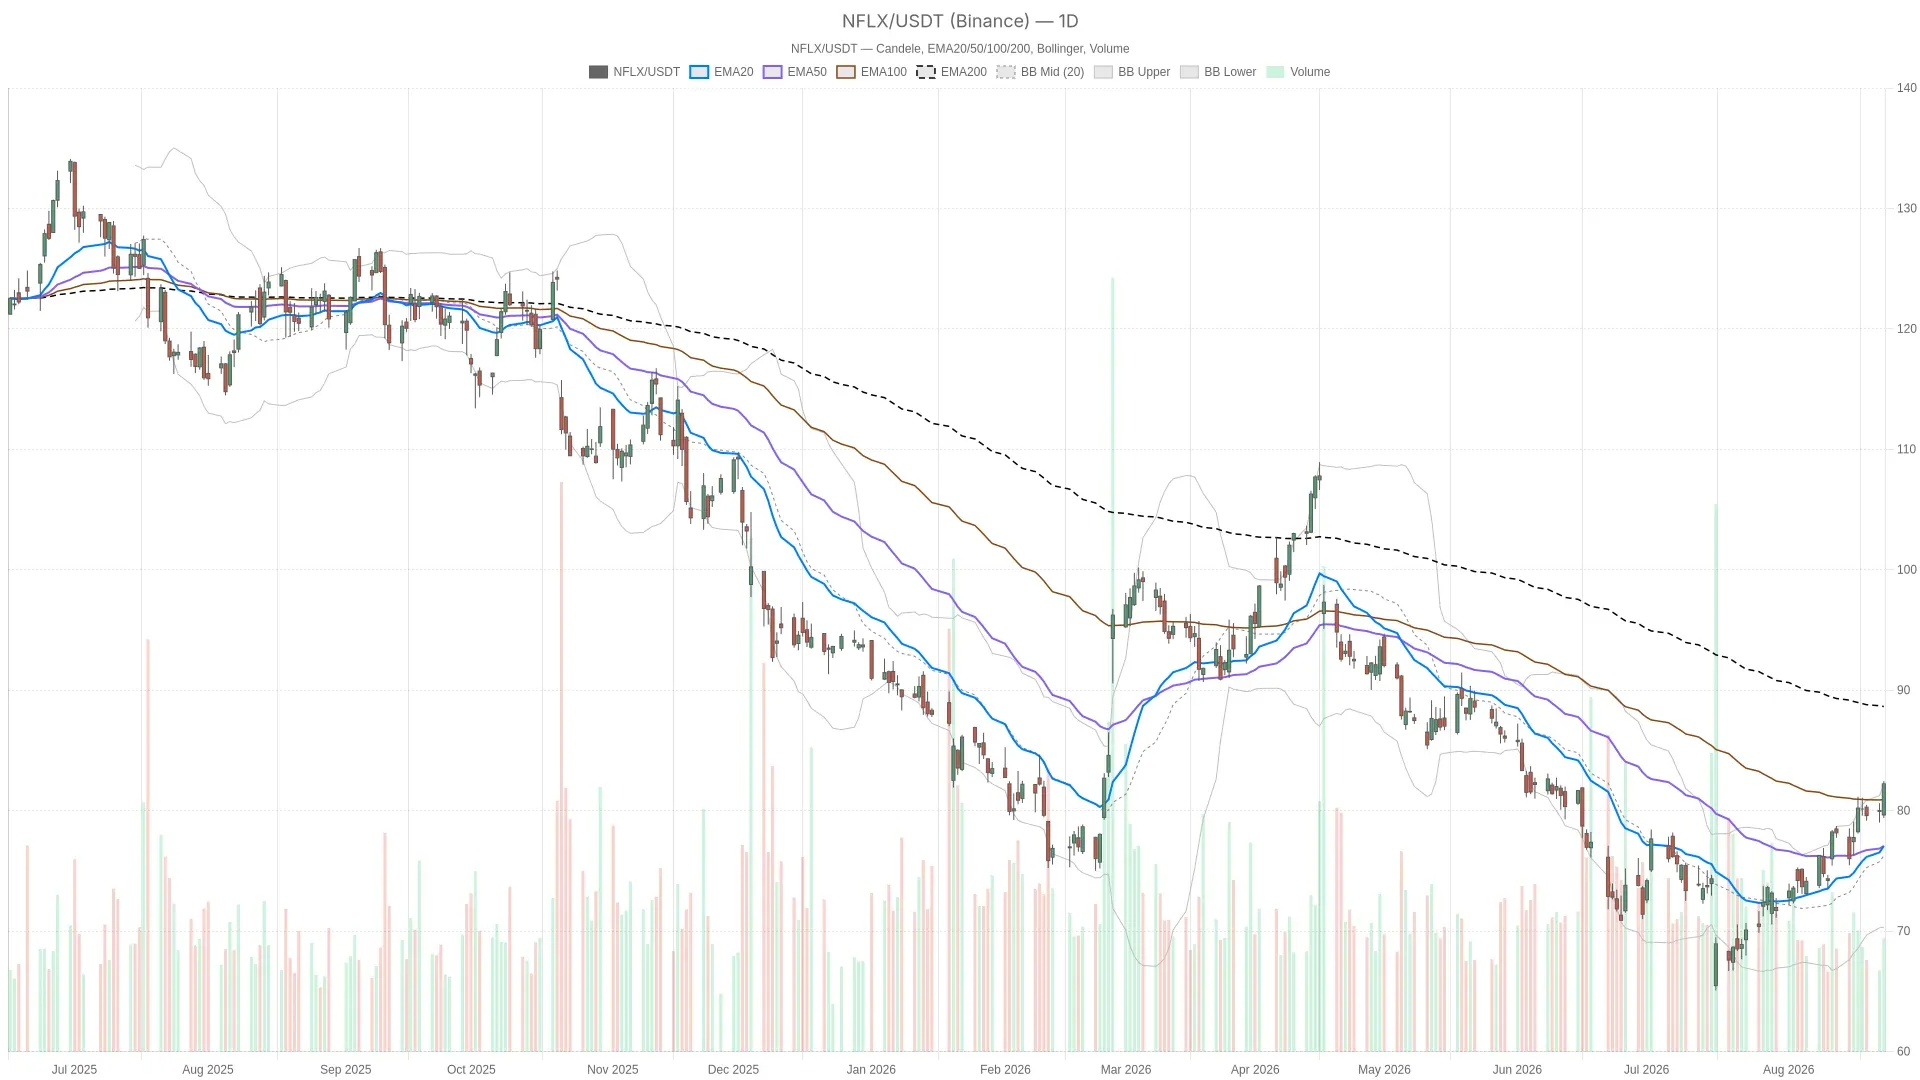
Netflix Stock Analysis: Bulls Regain Control Amid Key 200-Day Test

Netflix stock surged on August 25, closing at $82.23as Wolfe Research raised its price target to $95from $84. The firm called the soft second quarter a scheduling issue, with engagement data pointing to stronger results. The move gives traders a real story, not just a technical bounce.  NFLX — daily chart with candlesticks, EMA20/EMA50 and volume.Key takeawaysNetflix stockclosed at $82.23 on August 25 after opening near $79.65.Wolfe Research lifted its price target to $95 from $84, citing improving engagement data.Daily RSI14 is 67.27, with the MACD line at 1.81 above its signal at 1.07.Price remains below the 200-day EMA at $88.65, keeping the daily regime neutral.The hourly chart shows a bullish EMA stack, but intraday momentum is starting to fade.  Netflix Stock: Daily Structure Still Battles the 200-Day Trend  The daily chart remains a battleground because momentum is strong, but the longer trend is not yet repaired. Netflix stockstill trades beneath its 200-day average even after the surge.  On the daily chart, momentum indicators are unambiguously bullish. RSI14 sits at 67.27, pushing toward overboughtbut not yet flashing exhaustion. The MACD line at 1.81 remains above its signal at 1.07, with a positive histogram of 0.75. That is a textbook bullish momentum reading.  However, the daily

08-26Industry

Arthur Hayes Says Treasury Buybacks Are Fueling a Bitcoin Bull Market

TLDRArthur Hayes says expanded US Treasury bond buybacks are behind Bitcoins recent surgeBitcoin jumped from around $64,000 to above $80,000 after the August 19 buyback announcementTreasury will raise buyback limits to at least $4 billion per operation starting September 9US spot Bitcoin ETFs took in $517 million on August 19, the highest daily inflow since MayHayes says his fund has moved to maximum risk exposure in Bitcoin and Ether  Arthur Hayes, co-founder of BitMEX, published an essay on August 25 saying Bitcoin has entered a new bull market. He ties this directly to a US Treasury decision to expand its bond buyback program.  Treasury Secretary Scott Bessent announced on August 19 that buyback limits would at least double. The cap per operation will rise from $2 billion to at least $4 billion between September 9 and November 4.  Hayes argues that buying older, long dated bonds pushes their prices up and yields down. Lower yields, he says, make assets like Bitcoin look more attractive to investors.  “Same Same But Different” is an essay on why you should back up the truck and buy crypto with both hands.  Bad Gurl Yellen and Buffalo Bill Bessent are the same whether their rhetoric before taking office differed. They

08-26Industry
1
...
282284
...
1000