






Bitcoin‘s short-term outlook is bearish, while its medium-term outlook remains neutral to cautiously bullish. However, next week’s FOMC meeting and Bank of Japan (BOJ) policy meeting are key catalysts that could determine the markets next major move. Before these events unfold, the optimal strategy is to reduce leverage and trade within a defined range rather than bet on a decisive breakout in either direction.
1. Weekly Market Review (October 19–23): An Early Rally Followed by a Pullback, with Short-Term Bearish Signals
This week, the market showed a structural divergence: BTC staged intermittent recoveries, while ETH continued to experience persistent capital outflows.
Bitcoin (BTC) rebounded from lows near $81,000 at the beginning of the week, briefly recovering to $84,800 before encountering resistance at $85,000. It subsequently retreated to around $81,800 as of October 23. On the 4-hour chart, BTC fell back below MA5 and MA10. On the daily chart, MA5 ($82,462), MA10 ($82,143), and MA20 ($82,937) formed a bearish configuration, creating overhead pressure. The failure to break above $85,000 was the most significant bearish signal of the week.
Ethereum (ETH) significantly underperformed BTC. Its price fluctuated within the $2,310–$2,530 range, repeatedly failing to sustain moves above $2,500–$2,550. As of October 23, ETH was trading at approximately $2,408, below MA5 and MA10 on both the 4-hour and daily charts. The daily MA20 at $2,494 also represented clear overhead resistance. The $2,400 level has been tested repeatedly in recent sessions, and whether ETH can hold this threshold will be critical in determining its short-term direction.
Capital flows provide the clearest evidence of this divergence. On October 20, U.S. spot Bitcoin ETFs recorded $527 million in net inflows, their largest single-day inflow in nearly a month. However, the trend reversed sharply on October 23, with net outflows reaching $635 million: IBIT saw $254 million in outflows, FBTC $217 million, and ARKB $109 million.
The situation for Ethereum ETFs was even more challenging. Cumulative net outflows for October reached $1.08 billion, a new monthly high for 2026, with another $110 million flowing out on October 23 alone.
The rapid inflows and outflows in BTC ETFs versus sustained withdrawals from ETH ETFs represent the markets most important underlying structural contradiction at present.
2. A Multidimensional Analysis of Market Drivers: Whale Rotation and the Fed Meeting as Key Turning Points
1. On-Chain Data and Whale Activity: Capital Rotation Rather Than a Wholesale Exit
On-chain data does not point to a systemic market exit. Instead, it suggests structural portfolio reallocation.
One whale or institutional investor has reportedly sold a cumulative 1,847.3 BTC (approximately $153 million) over 11 days since October 11, while purchasing 63,731 ETH at an average price of approximately $2,400.
The significance of this activity should be interpreted cautiously. It confirms the presence of substantial buying interest from large holders around the $2,400 level. However, this buying demand has not yet been sufficient to offset persistent selling pressure through ETF channels. A gap remains between ETHs ability to establish a price floor through accumulation and its ability to generate sustained upward momentum.
For BTC, addresses holding between 1,000 and 10,000 BTC have shifted from a net reduction of 62,600 BTC to a net accumulation of 5,230 BTC over a 60-day period. This suggests that large holders may be transitioning from distribution toward accumulation.
Santiment data also shows that Bitcoins 365-day MVRV ratio stands at just 2%, a relatively low level within the market cycle. This does not exhibit the typical valuation characteristics associated with a cyclical market top during a bull-to-bear transition.
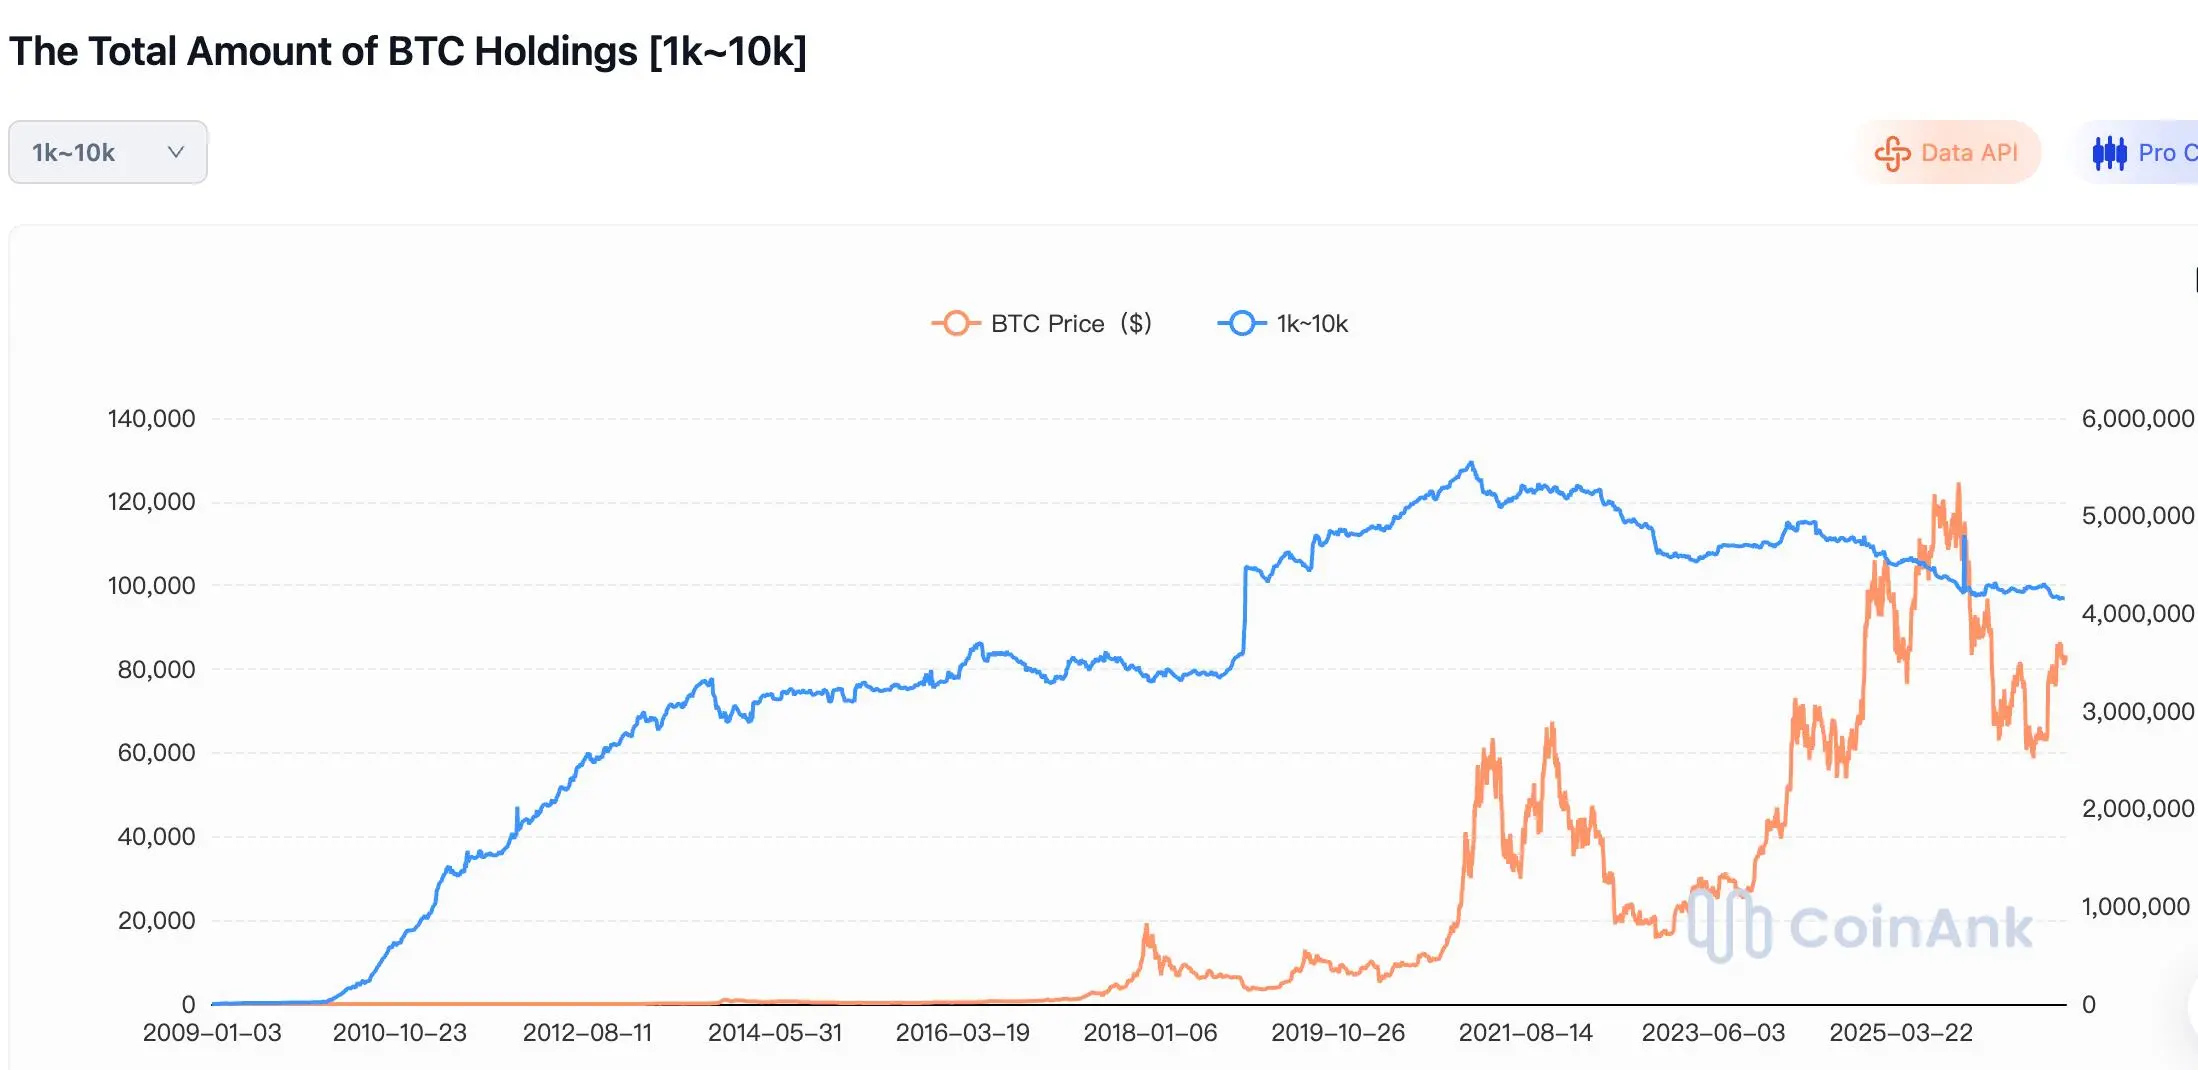
2. Macroeconomic and Central Bank Policy Dynamics: The Real Judge Is Off-Chain
Next week will bring one of the most concentrated macroeconomic event windows of late 2026:
October 29, 02:00: Federal Reserve interest rate decision; 02:30: Waller press conference.
October 29, 20:30: U.S. Q3 GDP advance estimate and September PCE data.
October 29–30: Bank of Japan (BOJ) monetary policy meeting.
The prevailing market expectation is that the Fed will hold rates steady in October and potentially hike again in December. CME FedWatch puts the probability of a December rate hike as high as 80.5%. The BOJ is also widely expected to leave rates unchanged in October, but the hawkishness of its forward guidance will be the key variable.
Japan‘s core CPI rose from 1.7% to 2.1% in September, exceeding the BOJ’s 2% target for the first time in nine months. Services inflation also climbed from 1.2% to 1.5%. These developments could pave the way for a rate hike to 1.50% in December.
The real tail risk is the unwinding of yen carry trades. After the BOJ raised rates to 0.25% in July 2024, BTC fell from around $70,000 to $49,000, providing a stress test of this same mechanism. If the BOJ adopts an explicitly hawkish tone in its October 30 forward guidance, investors who have borrowed yen to finance investments in riskier assets may unwind their positions ahead of schedule, potentially triggering nonlinear shocks across global risk assets, including cryptocurrencies.
One easily overlooked timing trap is that the PCE data will be released after the FOMC decision. Even if the Fed delivers a relatively dovish message in the early hours and markets rally, a hotter-than-expected PCE reading later that evening could completely reverse those gains within hours. This makes directional bets ahead of the meetings particularly unattractive from a risk-reward perspective.
3. BTC and ETH Futures Trading Strategies: Expect Range-Bound Trading First and Prioritize Position Sizing
Guiding principle: The levels below follow a framework of trading within a range before the events unfold and adjusting positions in response to signals afterward. During next weeks FOMC and BOJ meetings, highly leveraged directional positions face asymmetric liquidation risks. Position management should take priority over directional conviction.
BTC
Short term (before the event window, through October 29)
Bias: Sell rallies and buy dips within the range; do not bet on a one-way breakout.
Bearish setup (most attractive risk-reward): If BTC rebounds into the $82,800–$83,300 zone, where the 4-hour MA10/MA20 cluster and repeated resistance levels from this week converge, but fails to break through decisively, consider a small short position. Place the stop-loss above $84,800; a breakout above this week's rebound high would invalidate the setup. Set the first take-profit target at $81,000 and the second at $80,200.
Bullish setup (only consider at extreme levels): If BTC rapidly drops into the $79,800–$80,200 zone, near the previous 4-hour structural low, and shows clear signs of stabilizing, consider a small long position. Place the stop-loss below $79,200 and target $81,500–$82,000 for profit-taking.
Medium to long term (after the events, assessed on a weekly basis)
Core thesis: If neither the FOMC nor the BOJ delivers an unexpectedly hawkish shock, and BTC reclaims $83,000 and holds above it, a medium-term recovery could begin, opening the way toward $85,500–$86,500.
If an event-driven sell-off causes BTC to break decisively below $79,800, the medium-term strategy should shift to waiting for a potential reassessment opportunity in the $77,000–$78,000 region, where higher-timeframe structural support lies, rather than chasing shorts immediately after the breakdown.
ETH
Short term (before the event window, through October 29)
Bias: Prioritize capital preservation and closely monitor whether ETH can hold $2,400.
Bearish setup: If ETH rebounds into the $2,450–$2,490 zone, where the 4-hour MA10/MA20 and daily MA20 converge as resistance, but fails to hold above that range, consider a small short position. Place the stop-loss above $2,520, with an initial take-profit target of $2,380 and a secondary target of $2,310.
Bullish setup (requires extra caution): ETH's capital-flow backdrop is weaker than BTC's, so the threshold for entering a long position should be higher. Consider a small long position only if ETH forms a clear bullish reversal pattern in the $2,360–$2,380 zone and BTC simultaneously stabilizes. Place the stop-loss below $2,310, near the previous 4-hour low, and target $2,440–$2,480.
With ETFs continuing to experience net outflows, ETH longs have a significantly narrower margin for error than BTC longs.
Medium to long term (after the events)
Core thesis: The $2,400 level matters for ETH because a whale's reported average purchase price is concentrated around this area, while staking—which locks up approximately 35.9% of the circulating supply—provides a degree of support on the supply side.
If ETH reclaims $2,490–$2,500 after the events and ETF outflows begin to slow, a medium-term recovery toward $2,600–$2,700 becomes possible. Conversely, if ETH breaks decisively below $2,360, the next structural support zone shifts down to $2,250–$2,300.
4. Overall Investment Strategy: Protect Your Capital to Preserve Future Opportunities
First, the primary objective during event week is to survive, not to make money.
Next week combines the FOMC decision, PCE inflation data, GDP figures, and the BOJ meeting. Any unexpected outcome could trigger a chain reaction across asset classes.
The guiding principles are straightforward: reduce high-leverage exposure before the volatility window, maintain sufficient liquidity, and wait for key data releases before making directional decisions instead of opening positions based on expectations in advance.
This is not the time to demonstrate courage in predicting market direction. It is the time to demonstrate discipline in managing positions.
Second, BTC and ETH deserve different strategic weightings.
The divergence in capital flows is an observable fact. Although BTC ETFs have experienced significant volatility, they can still attract substantial intermittent inflows. ETH ETFs, by contrast, are experiencing persistent and systematic outflows.
This means that, given otherwise comparable technical signals, bullish signals in BTC may be more reliable than those in ETH, while bearish signals in ETH may be more reliable than those in BTC.
If expressing a directional view through only one asset, trading BTC's range by selling rallies and buying dips is preferable to making an outright directional bet on ETH.
Third, the window for medium- to long-term positioning may be approaching, but approaching does not mean now.
Three factors point toward potentially limited downside over the medium term: whale accumulation of ETH around $2,400, a shift among large BTC holders from distribution toward accumulation, and MVRV levels near the lower end of the cycle.
However, this thesis requires a catalyst to play out: either a marginal easing of expectations for monetary tightening or clear evidence of demand absorbing selling pressure at key support levels.
Until the outcomes of the October 29–30 events become clear, preserving capital for future opportunities is more important than positioning prematurely.
5. Outlook for Next Week: Don't Gamble on Direction
The base-case scenario for next week is high volatility, a wide trading range, and a directional move only after the key events unfold.
The most important factor to watch is not the rate decisions themselves. Markets have already largely priced in an October Fed pause and an unchanged BOJ policy rate. The real catalysts will be subtle shifts in wording and forward guidance.
If the Fed's statement or Waller's press conference weakens expectations for a December rate hike, while the BOJ avoids a significant hawkish shift in its forward guidance, BTC could retest $85,000, while ETH could have an opportunity to recover toward $2,500.
The opposite scenario presents a much greater downside risk. If the Fed reinforces expectations for a December rate hike or the BOJ explicitly signals an accelerated pace of tightening, pressure from yen carry-trade unwinding could push BTC toward $78,000, or even $72,000 and below. ETH's $2,360 support would face a serious test, with the next downside target potentially below $2,230.
Until clearer signals emerge, maintaining low leverage, preserving liquidity, and focusing on the edges of the trading range rather than its midpoint represent the most attractive risk-management approach for the week.
WikiBit, a regulatory app co-building protection with over 1 billion crypto investors. More crypto exchange real-time regulation info, please feel free check and download WikiBit App athttps://www.wikibit.com/
Apple Store: https://apps.apple.com/sg/app/wikibit-crypto-reg-check/id1541570520
Google Play: https://play.google.com/store/apps/details?id=com.wikifx.wikibitglobal