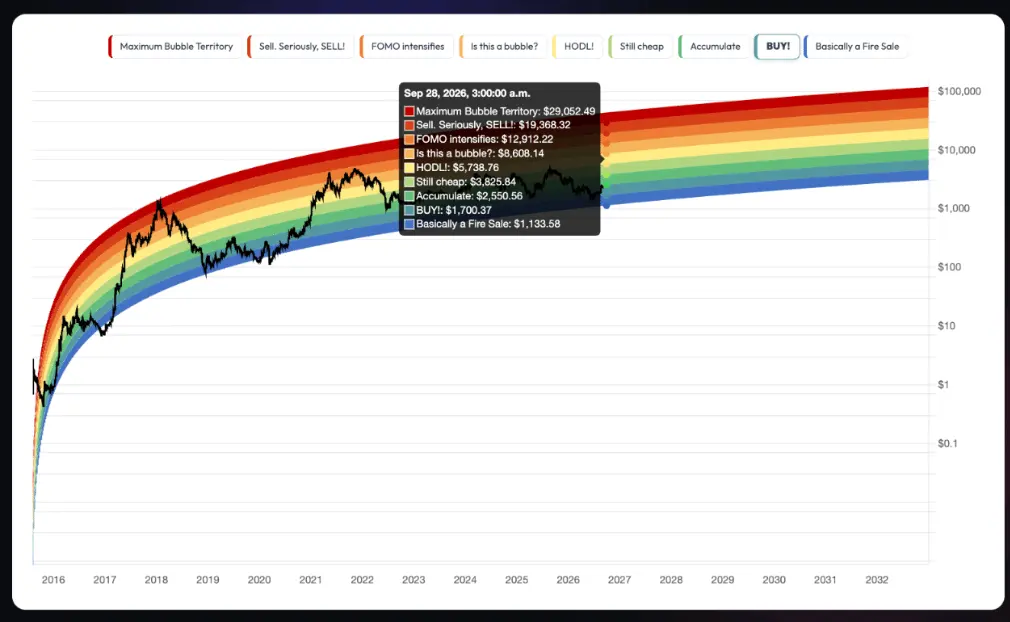



Ethereum Rainbow Chart predicts ETH price for end of September 2026
The Ethereum ($ETH) Rainbow Chart suggests $ETH could trade at approximately $2,551 by the end of September 2026, placing the cryptocurrency in the models Accumulate zone. With Ethereum trading around $2,400 as of press time, the projection implies a potential upside of about 6% over the remainder of the month. Notably, the outlook is based on BlockchainCenter‘s Ethereum Rainbow Chart, a long-term valuation model that uses Ethereum’s price history since 2015 to assess whether $ETH is trading below, near, or above its historical growth trend. According to the September 2026 Rainbow Chart bands, ‘Basically a Fire Sale’ ($1,134) signals extreme undervaluation; ‘BUY!’ ($1,700) indicates a buying opportunity, ‘Accumulate’ ($2,551) suggests gradual accumulation, and ‘Still cheap’ ($3,826) points to continued undervaluation. Ethereum Rainbow Chart. Source: Blockchain Centre Higher bands include ‘HODL!’ ($5,739), which reflects fair-value holding territory. ‘Is this a bubble?’ ($8,608), which signals rising speculation, and ‘FOMO Intensifies’ ($12,912), where investor exuberance becomes more pronounced. The top bands: ‘Sell. Seriously, SELL!’ ($19,368) and ‘Maximum Bubble Territory’ ($29,052), indicate historically overheated market conditions. Ethereum price analysis The prediction comes as Ethereum retreats from recent highs above $2,500, which coincided with a broader cryptocurrency market rally led by Bitcoin (BTC). At press time, $ETH was trading at $2,368, down about 3.4%