



Dogecoin Retests Triangle Apex That Starts a Parabolic Rally Every Time
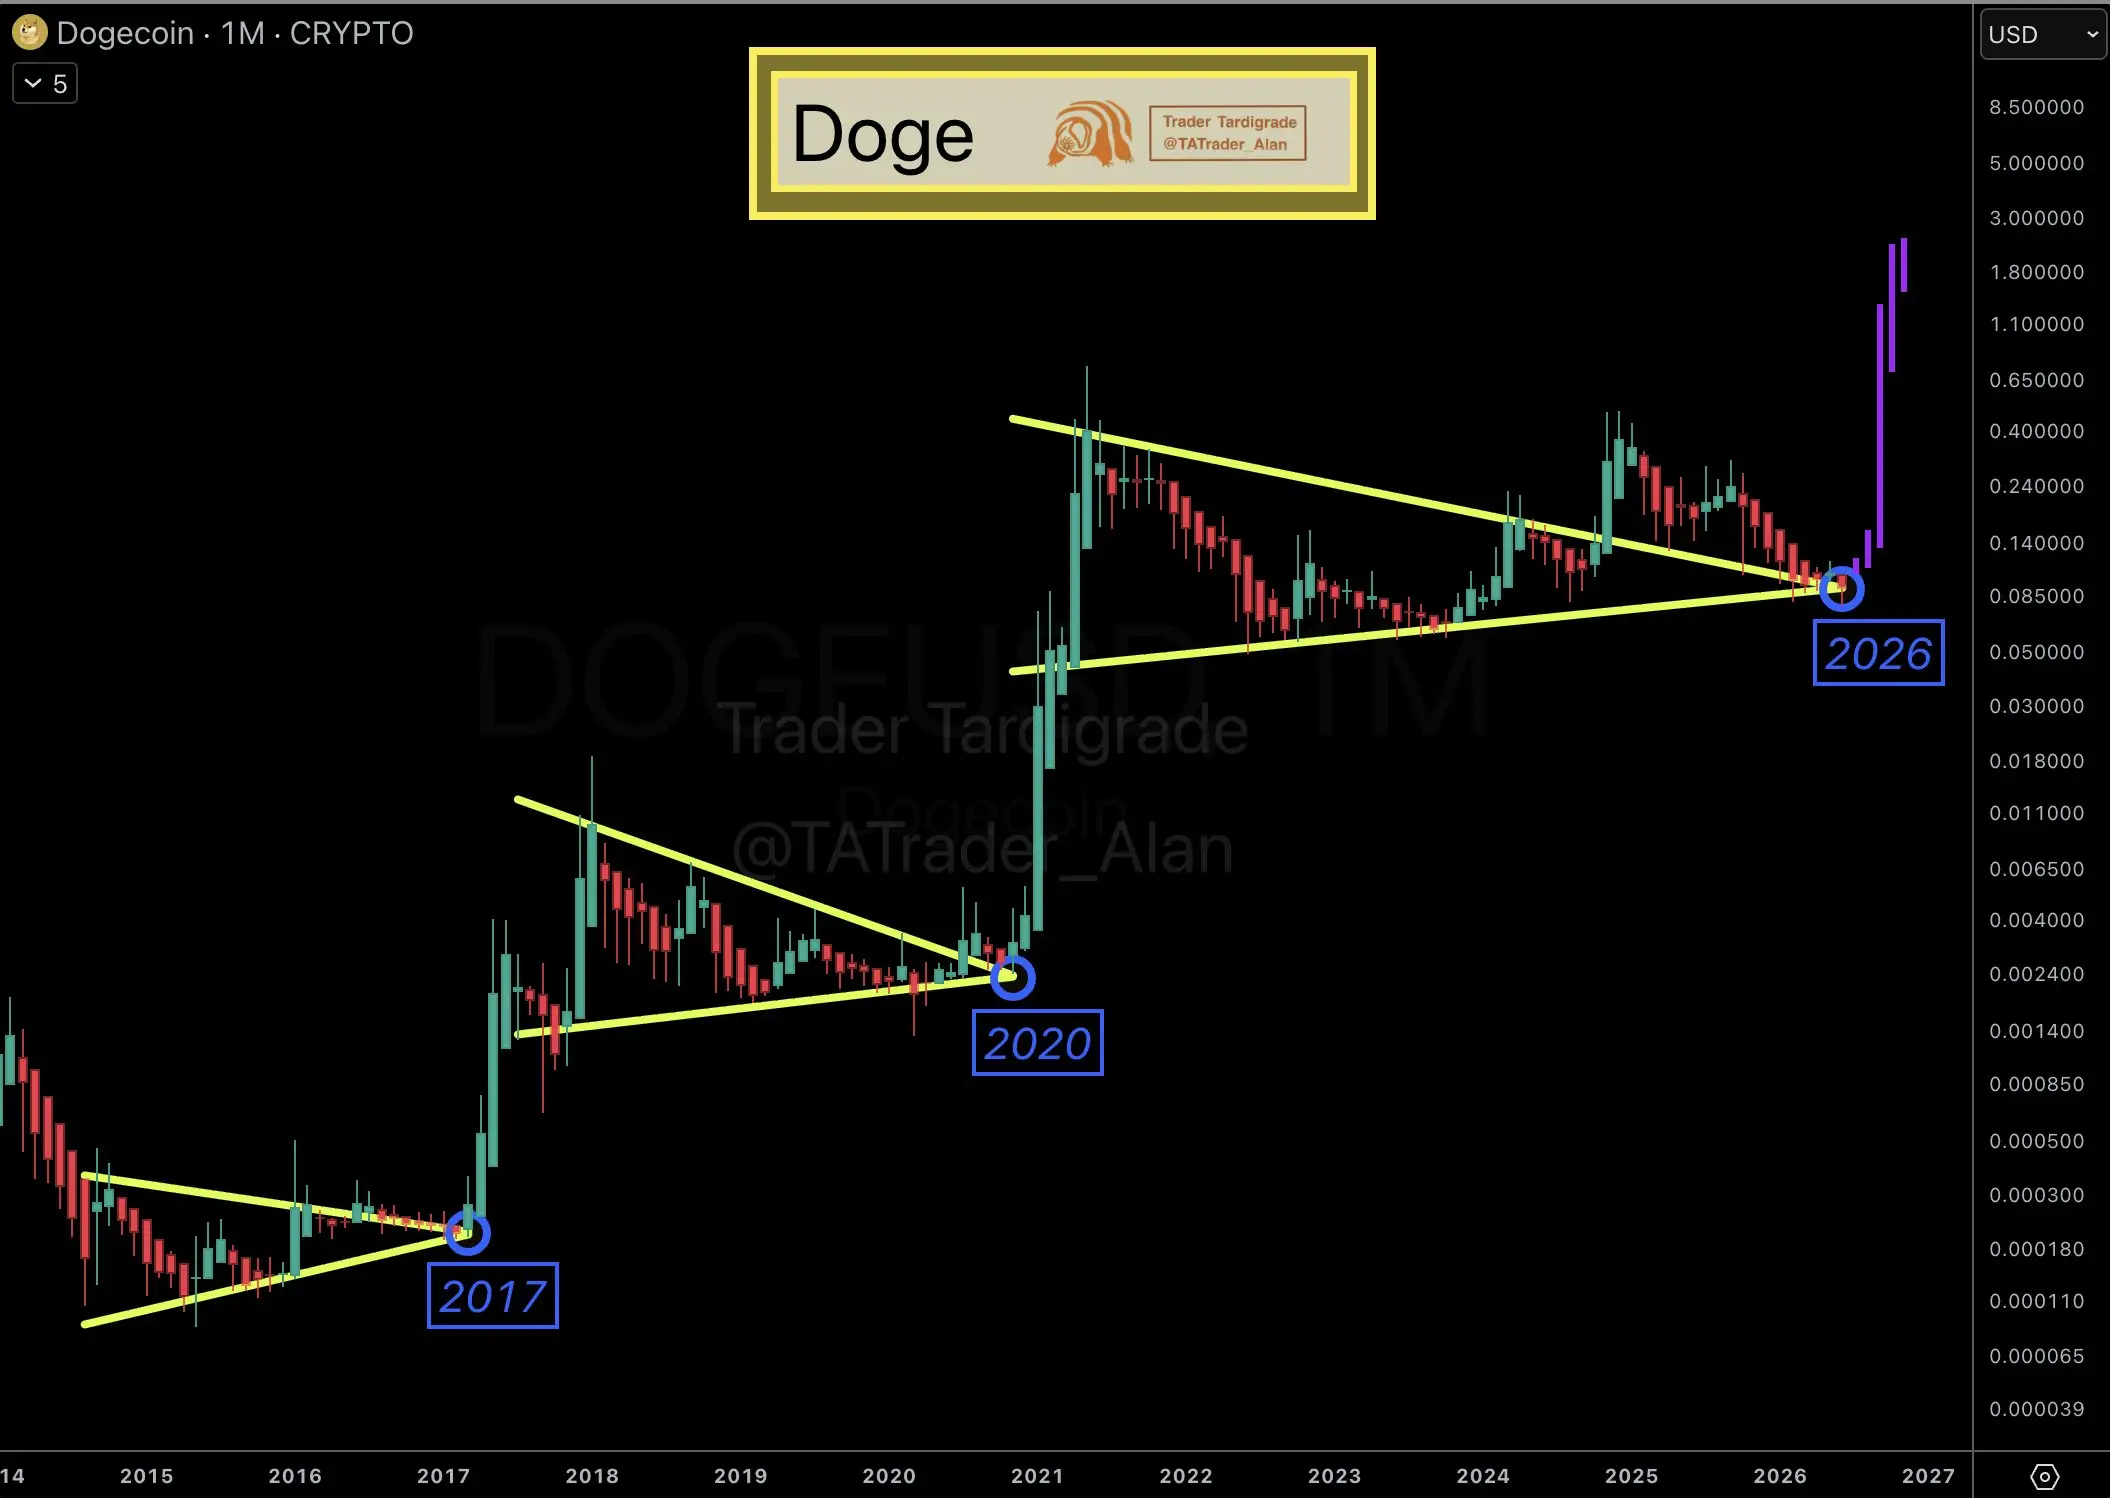
Dogecoin has repeated a chart structure that has appeared before some of its biggest historical moves, with analysts pointing to a possible price rally. Trader Tardigrade highlighted this recurring triangle pattern visible on the monthly Heikin Ashi chart in a June 14 X post. According to him, this setup is notable because it resembles formations that emerged ahead of the 2017 and 2020 breakouts to unprecedented prices. Dogecoin Repeats a Familiar Multi-Year Pattern The analyst identified a clear pattern that Dogecoin ($DOGE) has followed several times now. A triangle compression starts, then a breakout and apex retest, before a parabolic expansion follows. He further highlighted three different periods where Dogecoin spent years compressing inside a symmetrical triangle before eventually breaking out. The first formation developed between 2014 and early 2017, with the token breaking out from around $0.000208 in March 2017 to $0.0187 in January 2018. The second stretched from the 2018 high before a breakout in July 2020. The full bullish rally started in November 2020, sending $DOGE from $0.0025 to its current all-time high of $0.74. In both cases, prices gradually narrowed between rising support and falling resistance before reaching the triangles apex. Rather than immediately launching after the breakout, Dogecoin first revisited the