





The bears are in control of todays session, as seen from the increase in the global market cap. The total cap stood at $2.33T as of press time, representing a 3.93% decrease over the last 24 hours, while the trading volume jumped by 12.69% over the same period to stand at $94.86B as of press time.
Bitcoin Price Review
Bitcoin, $BTC, has posted minor gains in todays session, as seen from its price movements. Looking at an in-depth analysis, we see that the Moving Averages (50, 100, 200 SMA): Bitcoin is trading above the 100 and 200 SMA, with the price slightly pulling back near the 50 SMA, which may act as support. This indicates a potential continuation of the bullish trend if the price holds above these moving averages.
On the other hand, we see that the ADX (14) is at 32.45, indicating a relatively strong trend. If the ADX increases further, it may confirm the strength of the current trend. Bitcoin traded at $69,460 as of press time, representing a 3.39% decrease over the last 24 hours.
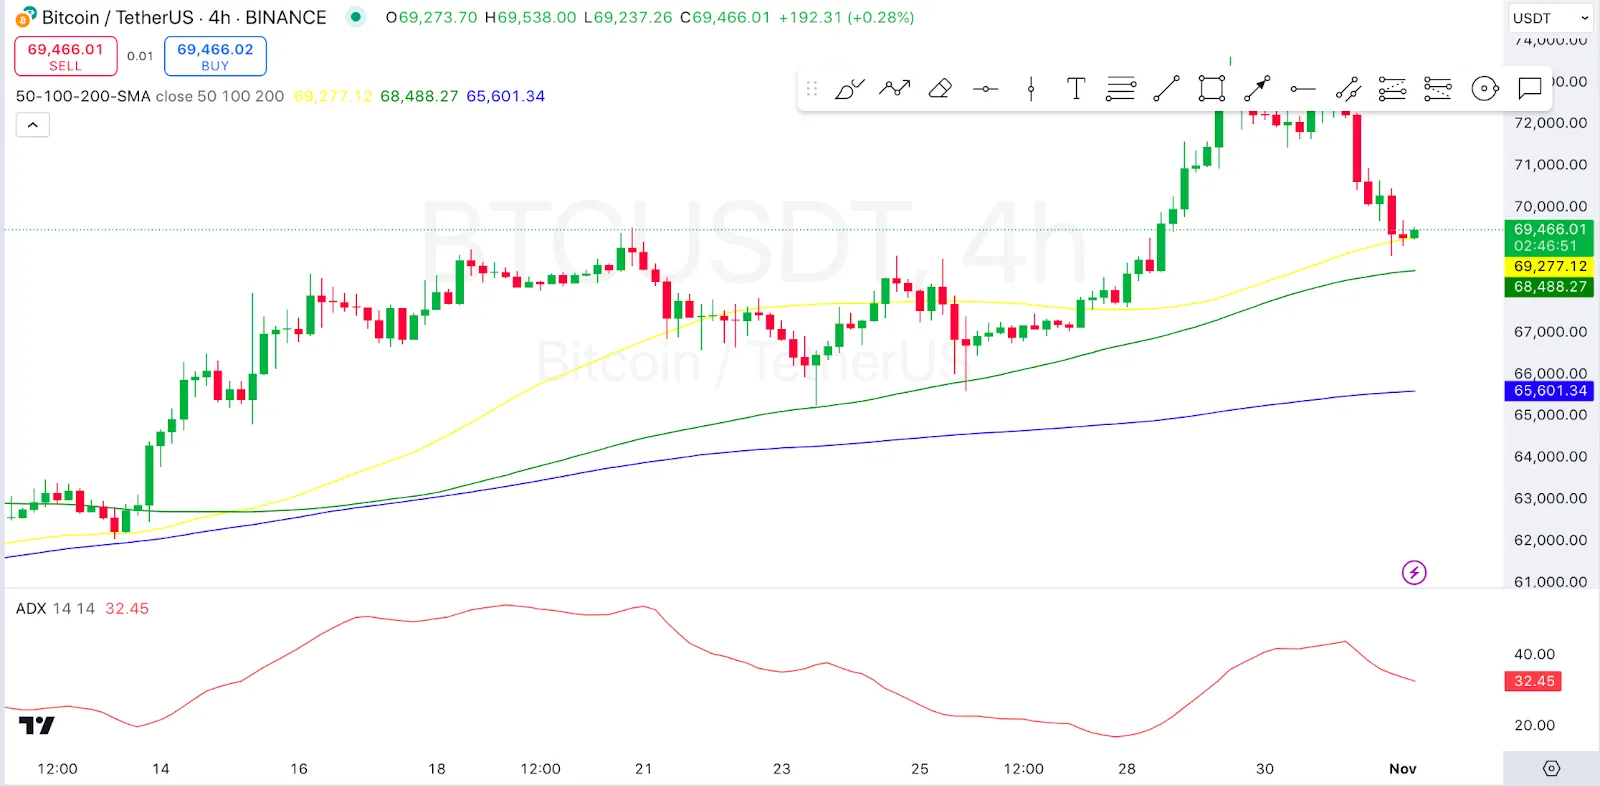
4-hour BTC|USD Chart | Source: TradingView
Ethereum Price Review
Ethereum, $ETH, is also not among the gainers in today‘s session as seen from its price movements. Looking at an in-depth analysis, we see that the Alligator’s lines are entangled, suggesting a consolidation or indecisive market period. A breakout above or below these lines could indicate the direction of the next move.
On the other hand, we see that the Money Flow Index is at 31.66, near the oversold region. This may imply that the market is nearing a point where buying pressure could return, potentially signaling a reversal if buying interest increases. Ethereum traded at $2,508 as of press time, representing a 5% decrease over the last 24 hours.
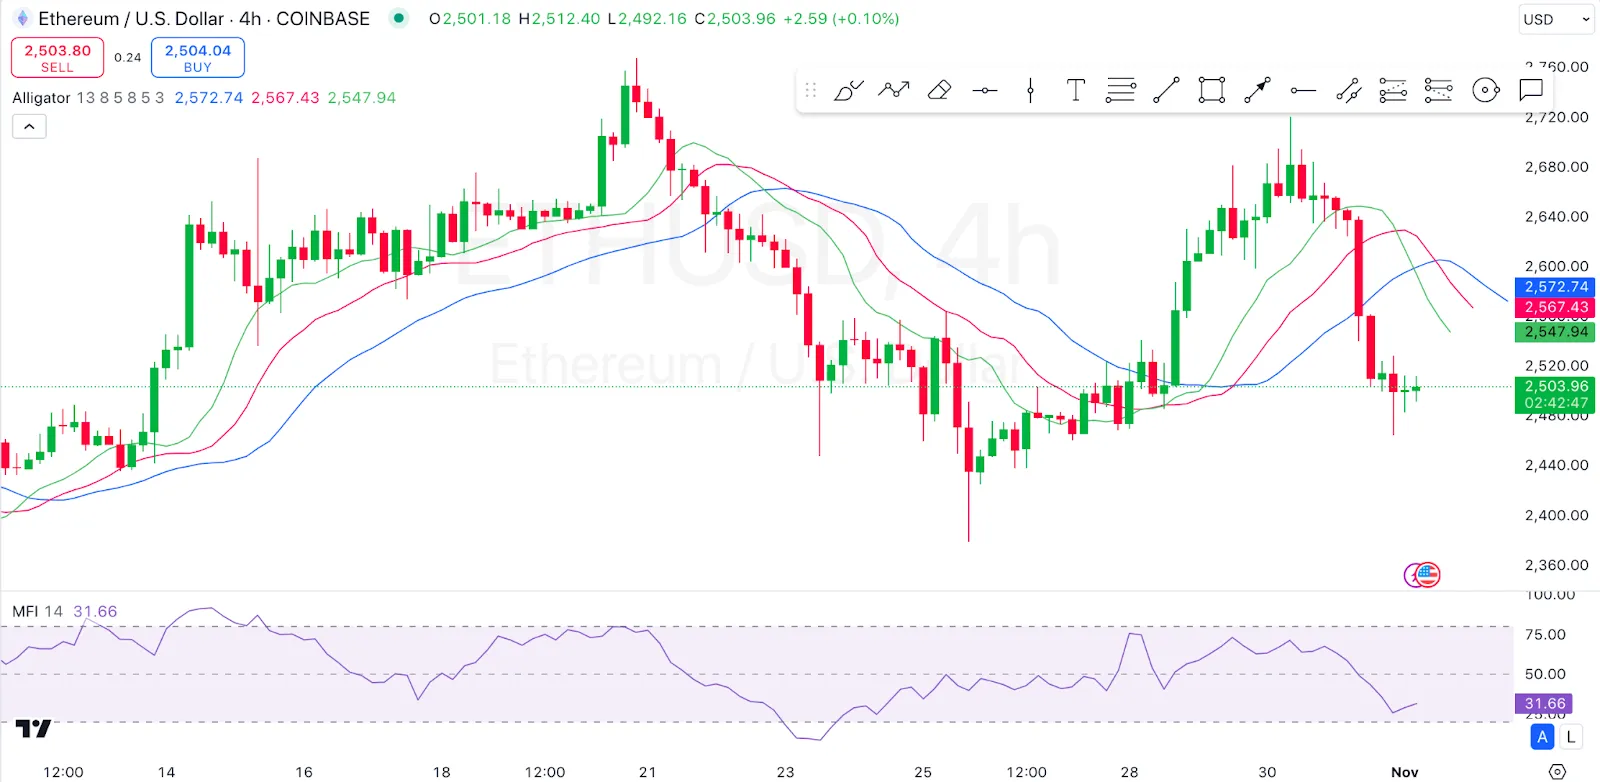
4-hour ETH/USD Chart | Source: TradingView
Kaspa Price Review
Kaspa, $KAS, is also among the gainers in today‘s session as also among the gainers in today’s session as also seen from its price movements. Looking at an in-depth analysis, we see that Kaspa is trading below all significant moving averages, indicating a bearish sentiment. The 50 SMA could act as immediate resistance.
On the other hand, we see that the Awesome Oscillator (AO) shows mixed red and green bars, suggesting ongoing bearish momentum with signs of slowing. An increase in green bars may indicate a possible reversal. Kaspa traded at $0.1179 as of press time, representing a 3.73% increase over the last 24 hours.
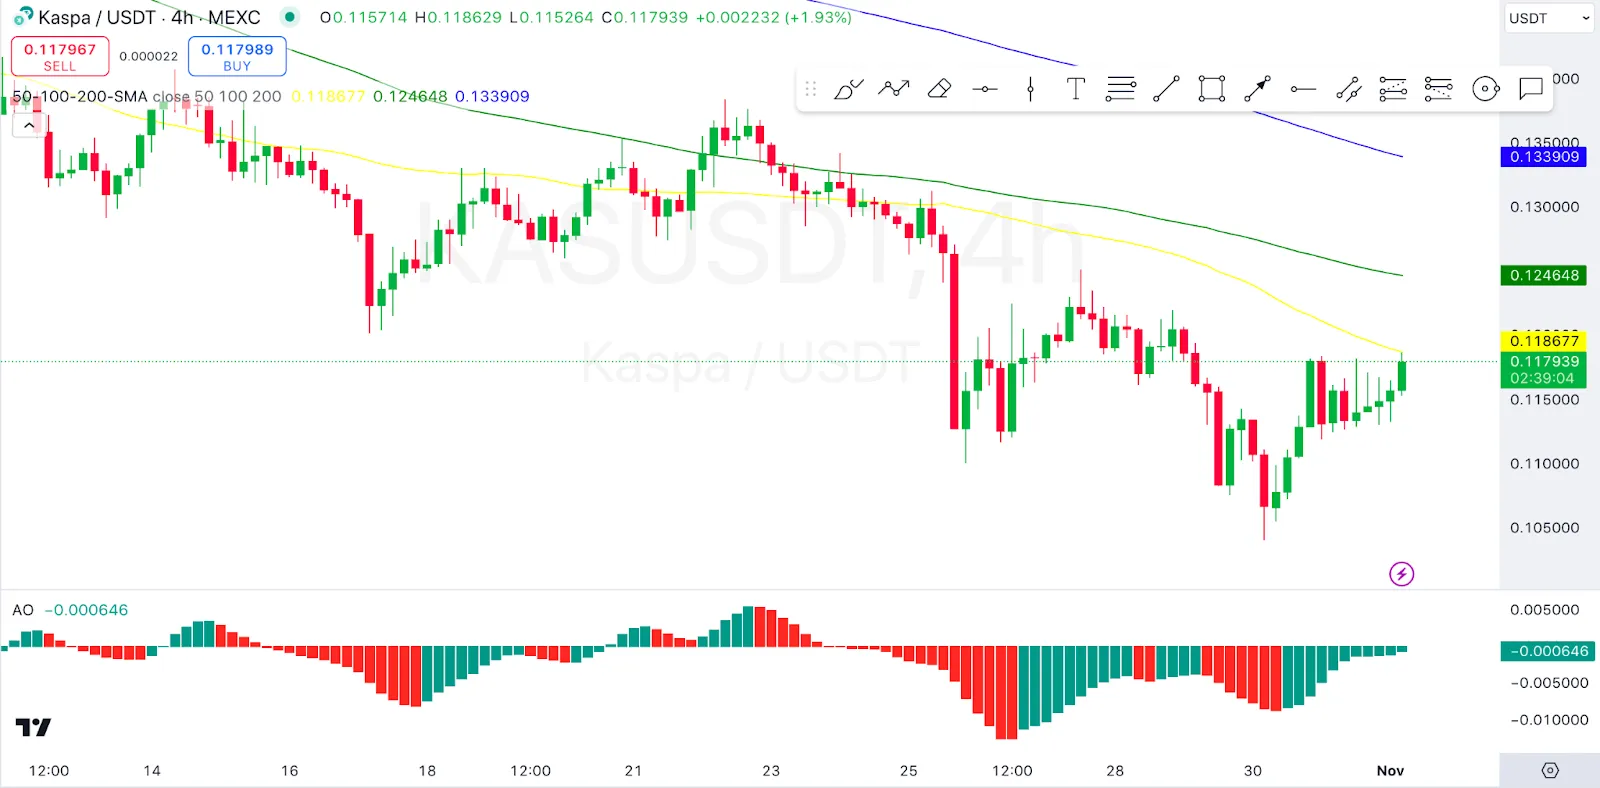
4-hour KAS/USD Chart | Source: TradingView
Raydium Price Review
Raydium, $RAY, is also among the gainers in today‘s session as also among the gainers in today’s session as also seen from its price movements. Looking at an in-depth analysis, the Raydium price has recently moved from the upper Bollinger Band, indicating a pullback. The bands are contracting slightly, which suggests reduced volatility and potential consolidation.
On the other hand, we see that the RSI is around 48.06, suggesting neutral momentum. This position reflects indecision, and a move below 40 could suggest more selling pressure, while a rise above 50 may indicate a bullish continuation. Raydium traded at $3.19 as of press time, representing a 1.81% increase over the last 24 hours.
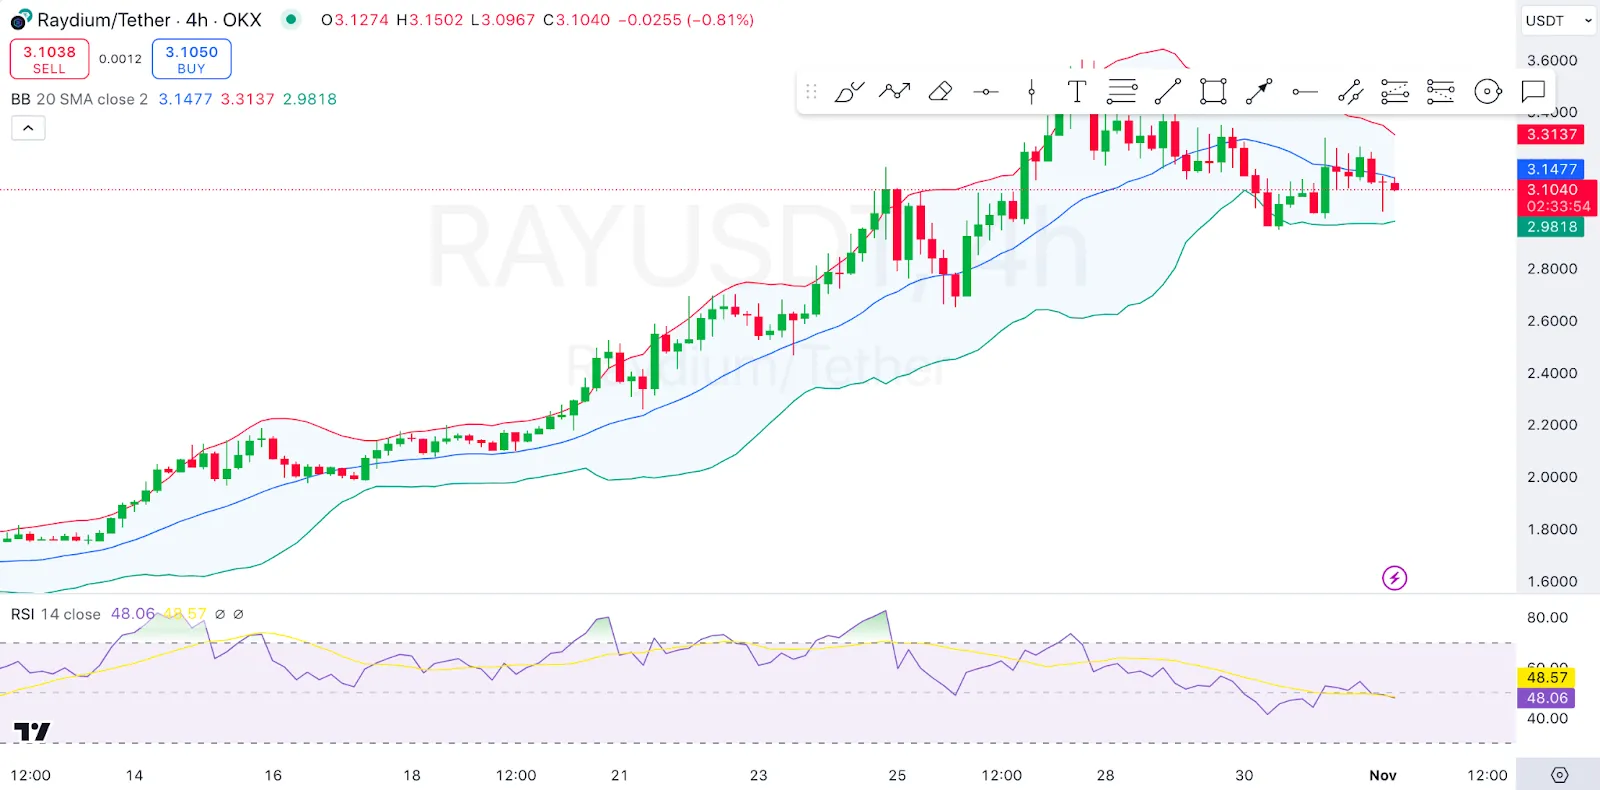
4-hour RAY/USD Chart | Source: TradingView
Celestia Price Review
Celestia, $TIA, is also among the gainers in todays session as seen from its price movements. Looking at an in-depth analysis, we see that the Supertrend is currently bearish, as shown by the red zone above the price, which suggests the bears are in control.
On the other hand, we see that the ADX level at 25.87 shows moderate trend strength. An increase in ADX could signal a stronger bearish trend if the price remains below the Supertrend line. Celestia traded at $4.76 as of press time, representing a 2.16% increase over the last 24 hours.
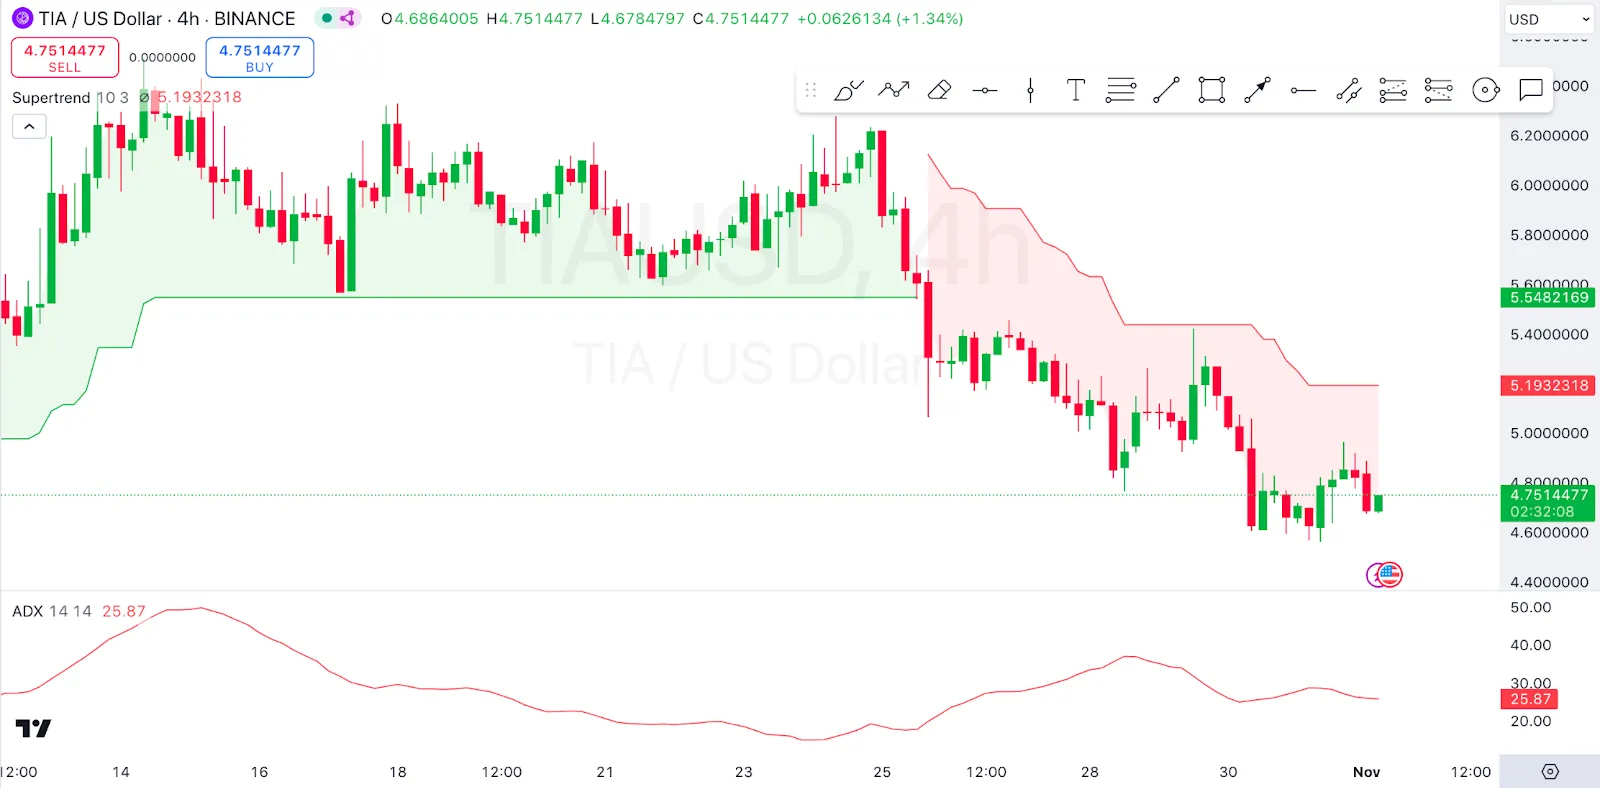
4-hour TIA/USD Chart | Source: TradingView