Invesco NASDAQ 100 ETF stock Analysis: Bullish Momentum Near Resistance
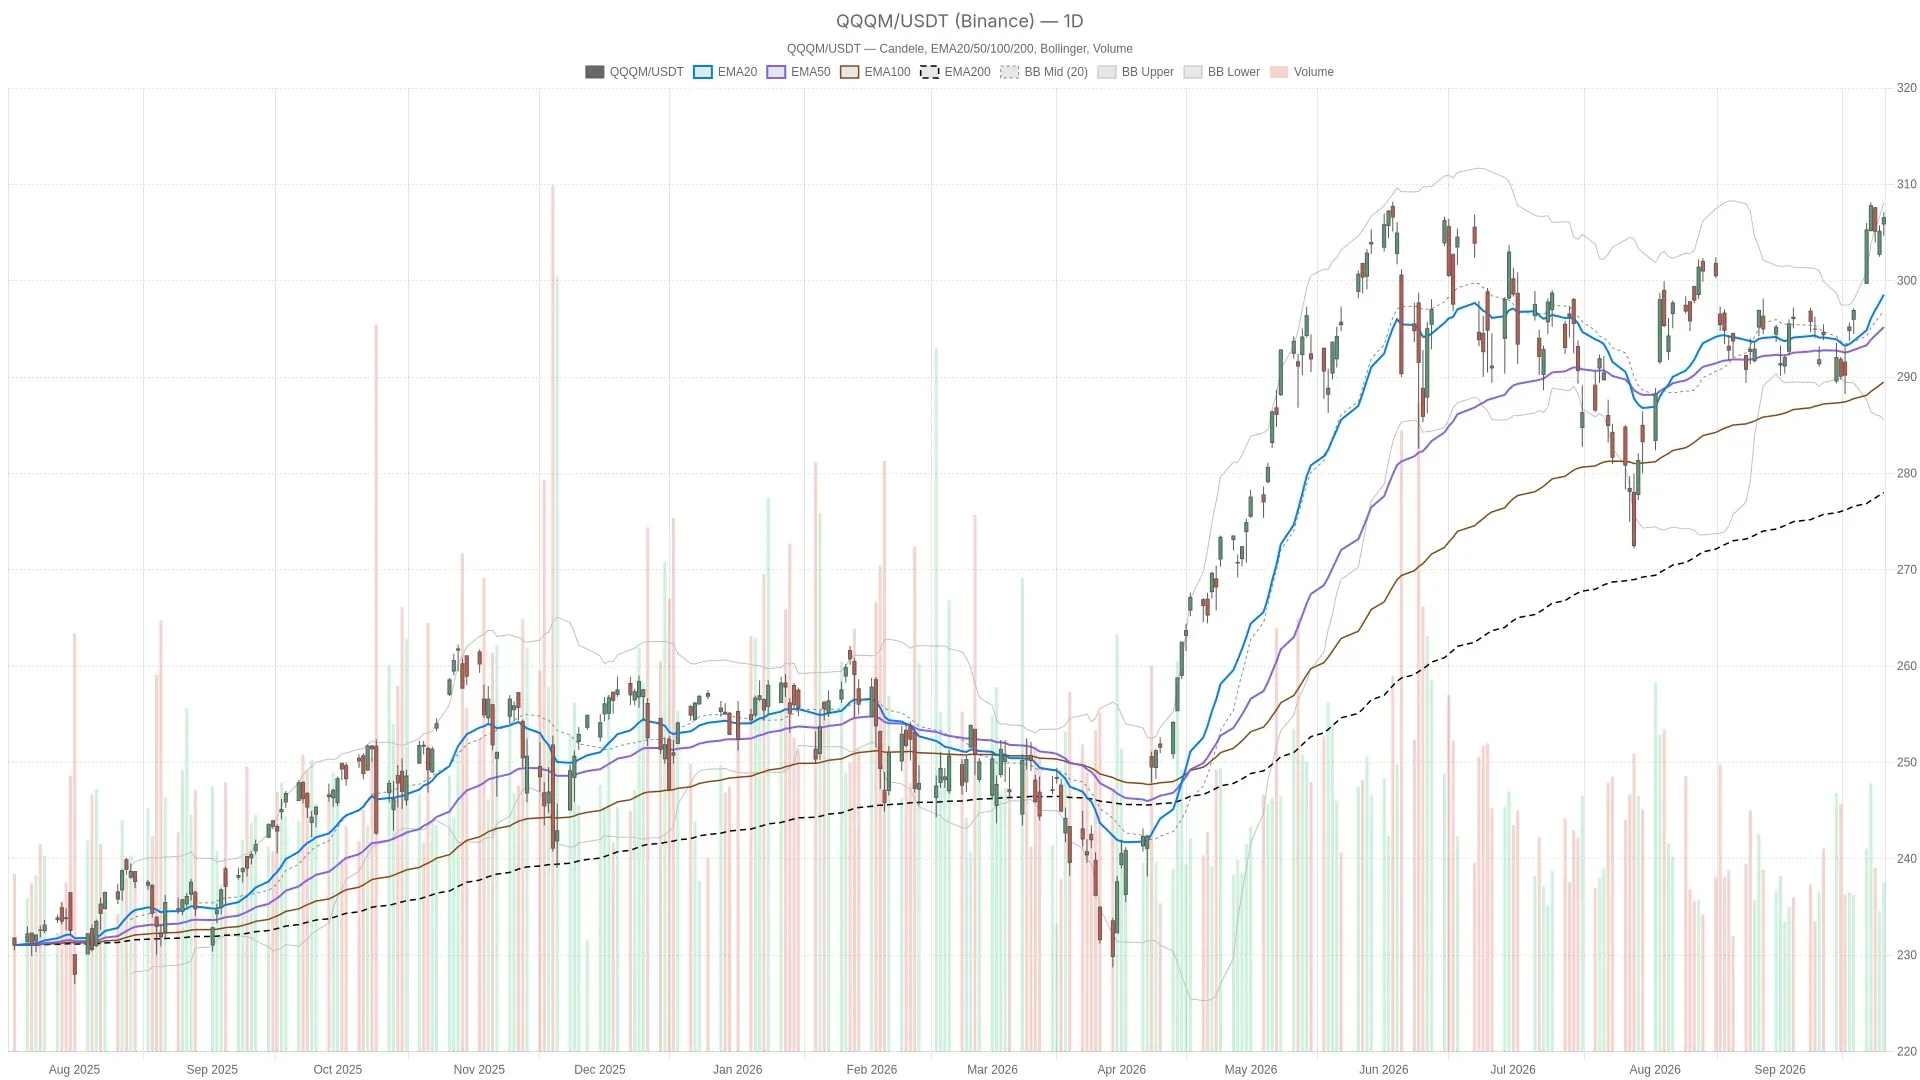
The Invesco NASDAQ 100 ETF stock (QQQM) closed at $306.54 on September 25, up 0.46%, pressing against the upper edge of its recent range. The daily trend remains firmly bullish, though shorter-term signals suggest the rally is pausing at resistance. QQQM — daily chart with candlesticks, EMA20/EMA50 and volume.Key takeawaysQQQMclosed at $306.54 on September 25, sitting above its 20-day EMA at $298.56, 50-day EMA at $295.20, and 200-day EMA at $278.02.The daily RSI14 reads 64.66, leaving room for further upside before momentum reaches overbought extremes.Daily MACD stands at 3.07, well above its signal line at 1.65, confirming expanding bullish momentum.Key resistance sits at $307.57(R1), with the Bollinger upper band near $308.09 forming a critical confluence zone.The hourly MACD has turned slightly negative, signaling short-term momentum fatigue within an otherwise intact daily uptrend. QQQM Daily Trend Remains Firmly Bullish QQQMs daily structure is unambiguously bullish. Price trades above all three key EMAs in textbook alignment, while expanding MACD momentum confirms the advance is part of a sustained move higher. On the daily timeframe, price sits above the 20-day EMA at $298.56, the 50-day EMA at $295.20, and the 200-day EMA at $278.02. That stacked alignment signals the move higher is not a short-lived bounce. The