Quantum-Si Incorporated Stock Analysis: 23% Surge & Overbought Signal
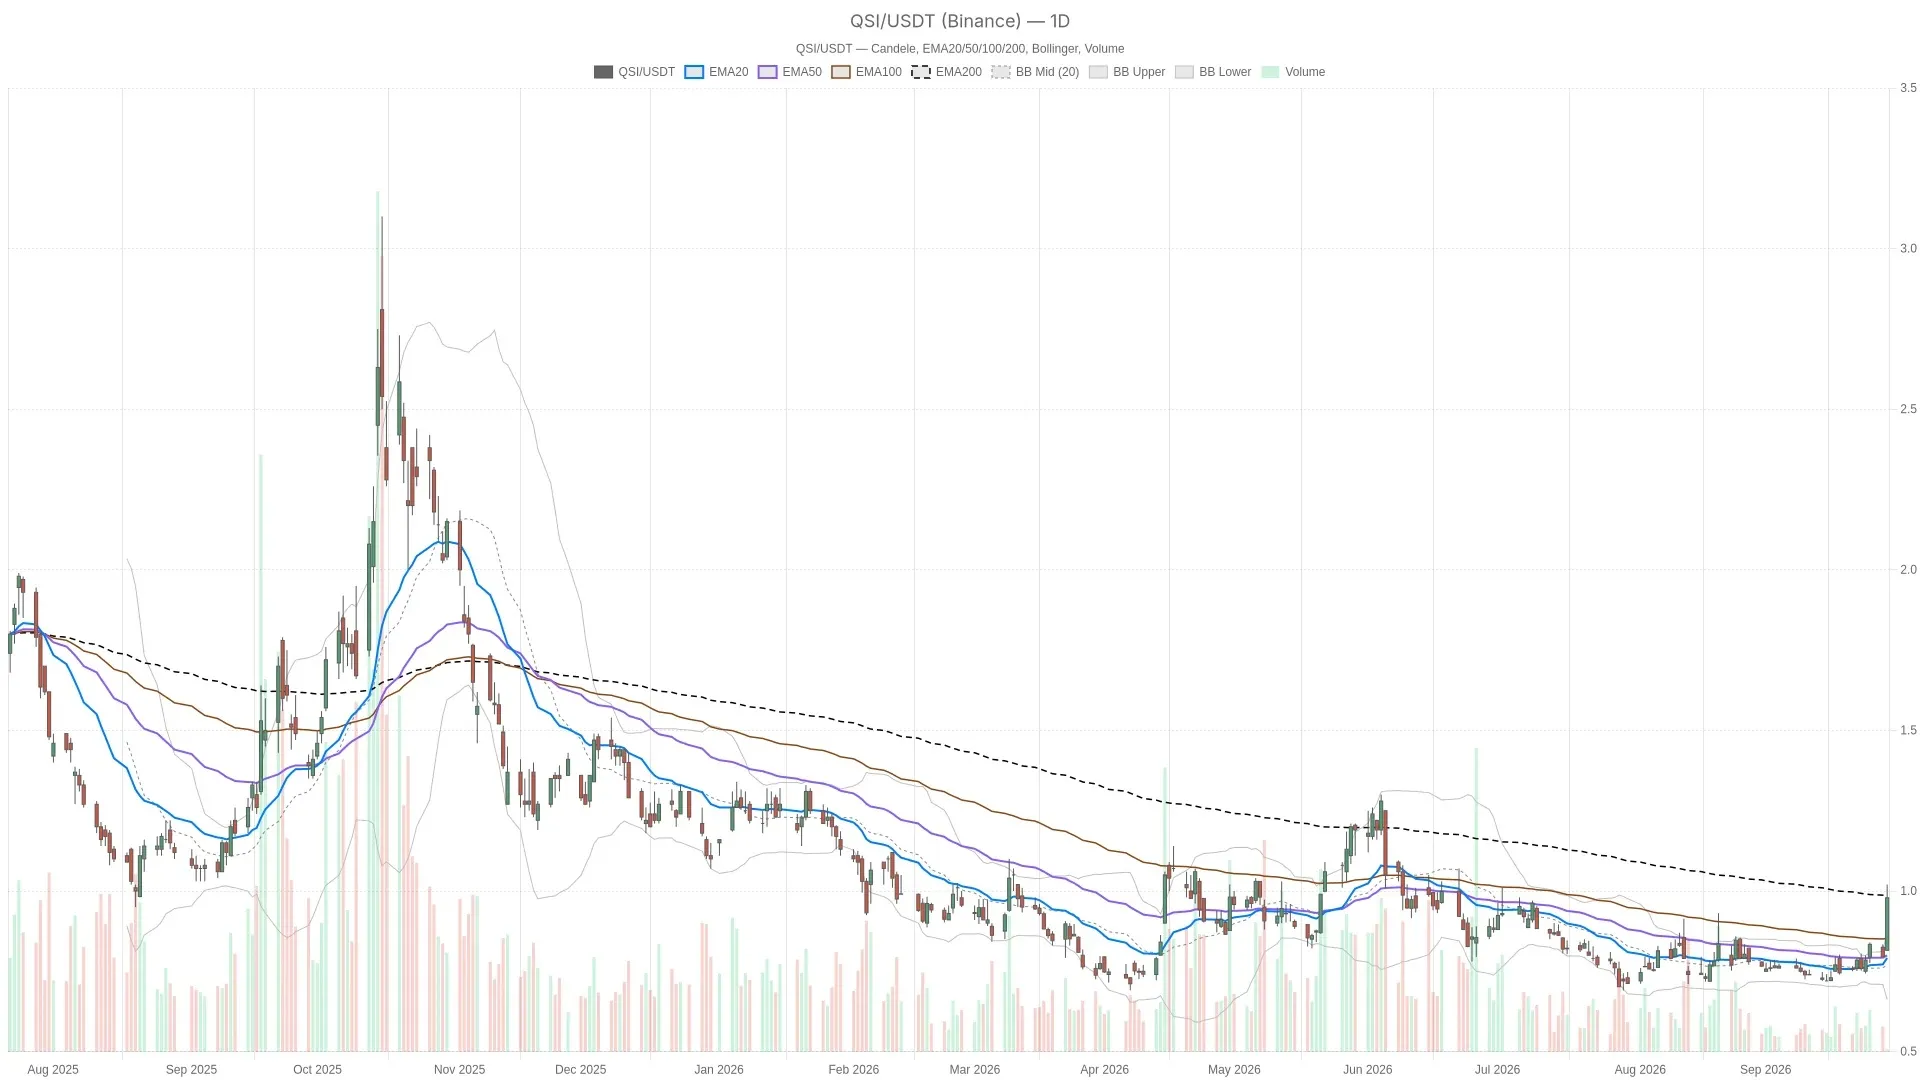
Quantum-Si Incorporated stock surged 23.13% intraday on September 29, jumping from a $0.795 close to $0.9789. The session remains open, so this is not a settled close. The size of the move raises a pressing question: genuine trend shift or overbought spike? QSI — daily chart with candlesticks, EMA20/EMA50 and volume.Key takeawaysQSI shares surged 23.13%intraday to $0.9789on September 29, with the session still activeDaily RSI14 reached 70.72and hourly RSI14 hit 74.7, both firmly in overbought territoryPrice cleared the 20-day and 50-day EMAs but faces critical resistance at the 200-day EMA ($1.01)Hourly charts confirm bullish momentum while warning of stretched positioning near the $1.00upper Bollinger BandCFO Jeffry Keyessold $5,805 in company stock; a Form 144 was filed on September 23 Quantum-Si Incorporated Stock Technical Analysis: Daily Breakout Meets Resistance The daily chart tells a nuanced story. Price opened at $0.82, pushed as high as $1.02, and now sits near $0.98. That puts QSI decisively above its 20-day EMA ($0.79) and 50-day EMA ($0.80). However, it remains below the 200-day EMA at $1.01. Short-term momentum has flipped bullish, while the longer-term trend average still caps the stock from above. The daily regime reading is neutral. That classification fits: an aggressive breakout attempt inside a structure