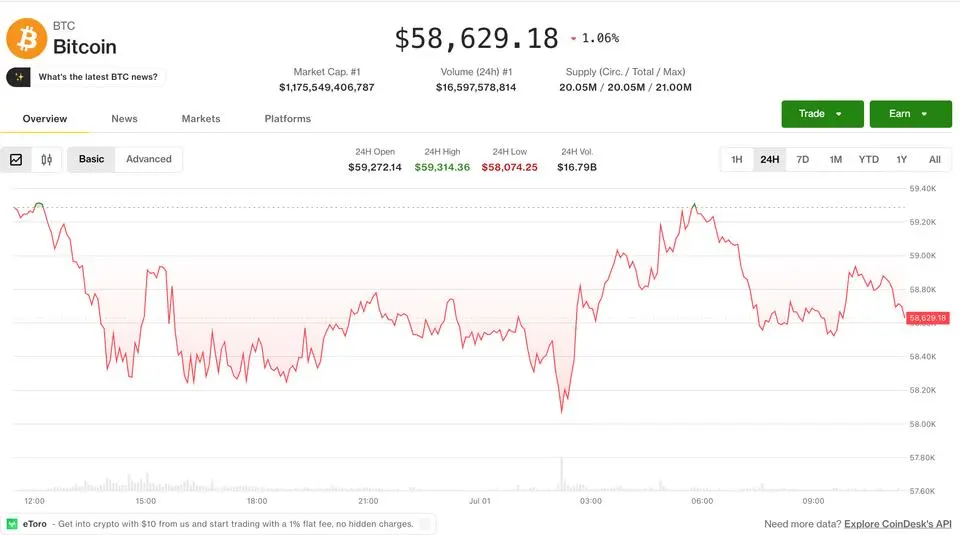
Bitcoin‘s 20% June crash looks even deadlier on the charts. Here’s why
SummaryBitcoin fell about 20% in June to below $60,000, marking its worst monthly performance since June 2022.The June monthly candle shows overwhelming bearish dominance, a rare occurrence on monthly charts and a strong warning of further losses ahead.The appearance of this candlestick pattern on the monthly chart signals decisively bearish sentiment, consistent with recent analysts predictions of a deeper slide and an eventual bottom in the $48,000 to $55,000 range. Bitcoin fell by 20% to under $60,000 in June, its worst monthly performance since the same month in 2022. If that number alone isnt enough to worry bulls, the price chart, especially the monthly candlestick, could be. The June candlestick, a charting tool summarizing entire months price action into a single visual, looks like a solid red brick with virtually no wicks, a clear sign of complete and “uninterrupted” bear dominance throughout the month. For anyone tracking price charts, thats about as bearish a signal as can be and a warning that more losses could happen in the weeks ahead. A candlestick captures four data points for any given period: where price opened, where it closed, how high it got, and how low it fell. The candle body shows the open-to-close move. The wicks –