Circle Stock Drops to $81 as Visa and Mastercard Back Rival Stablecoin
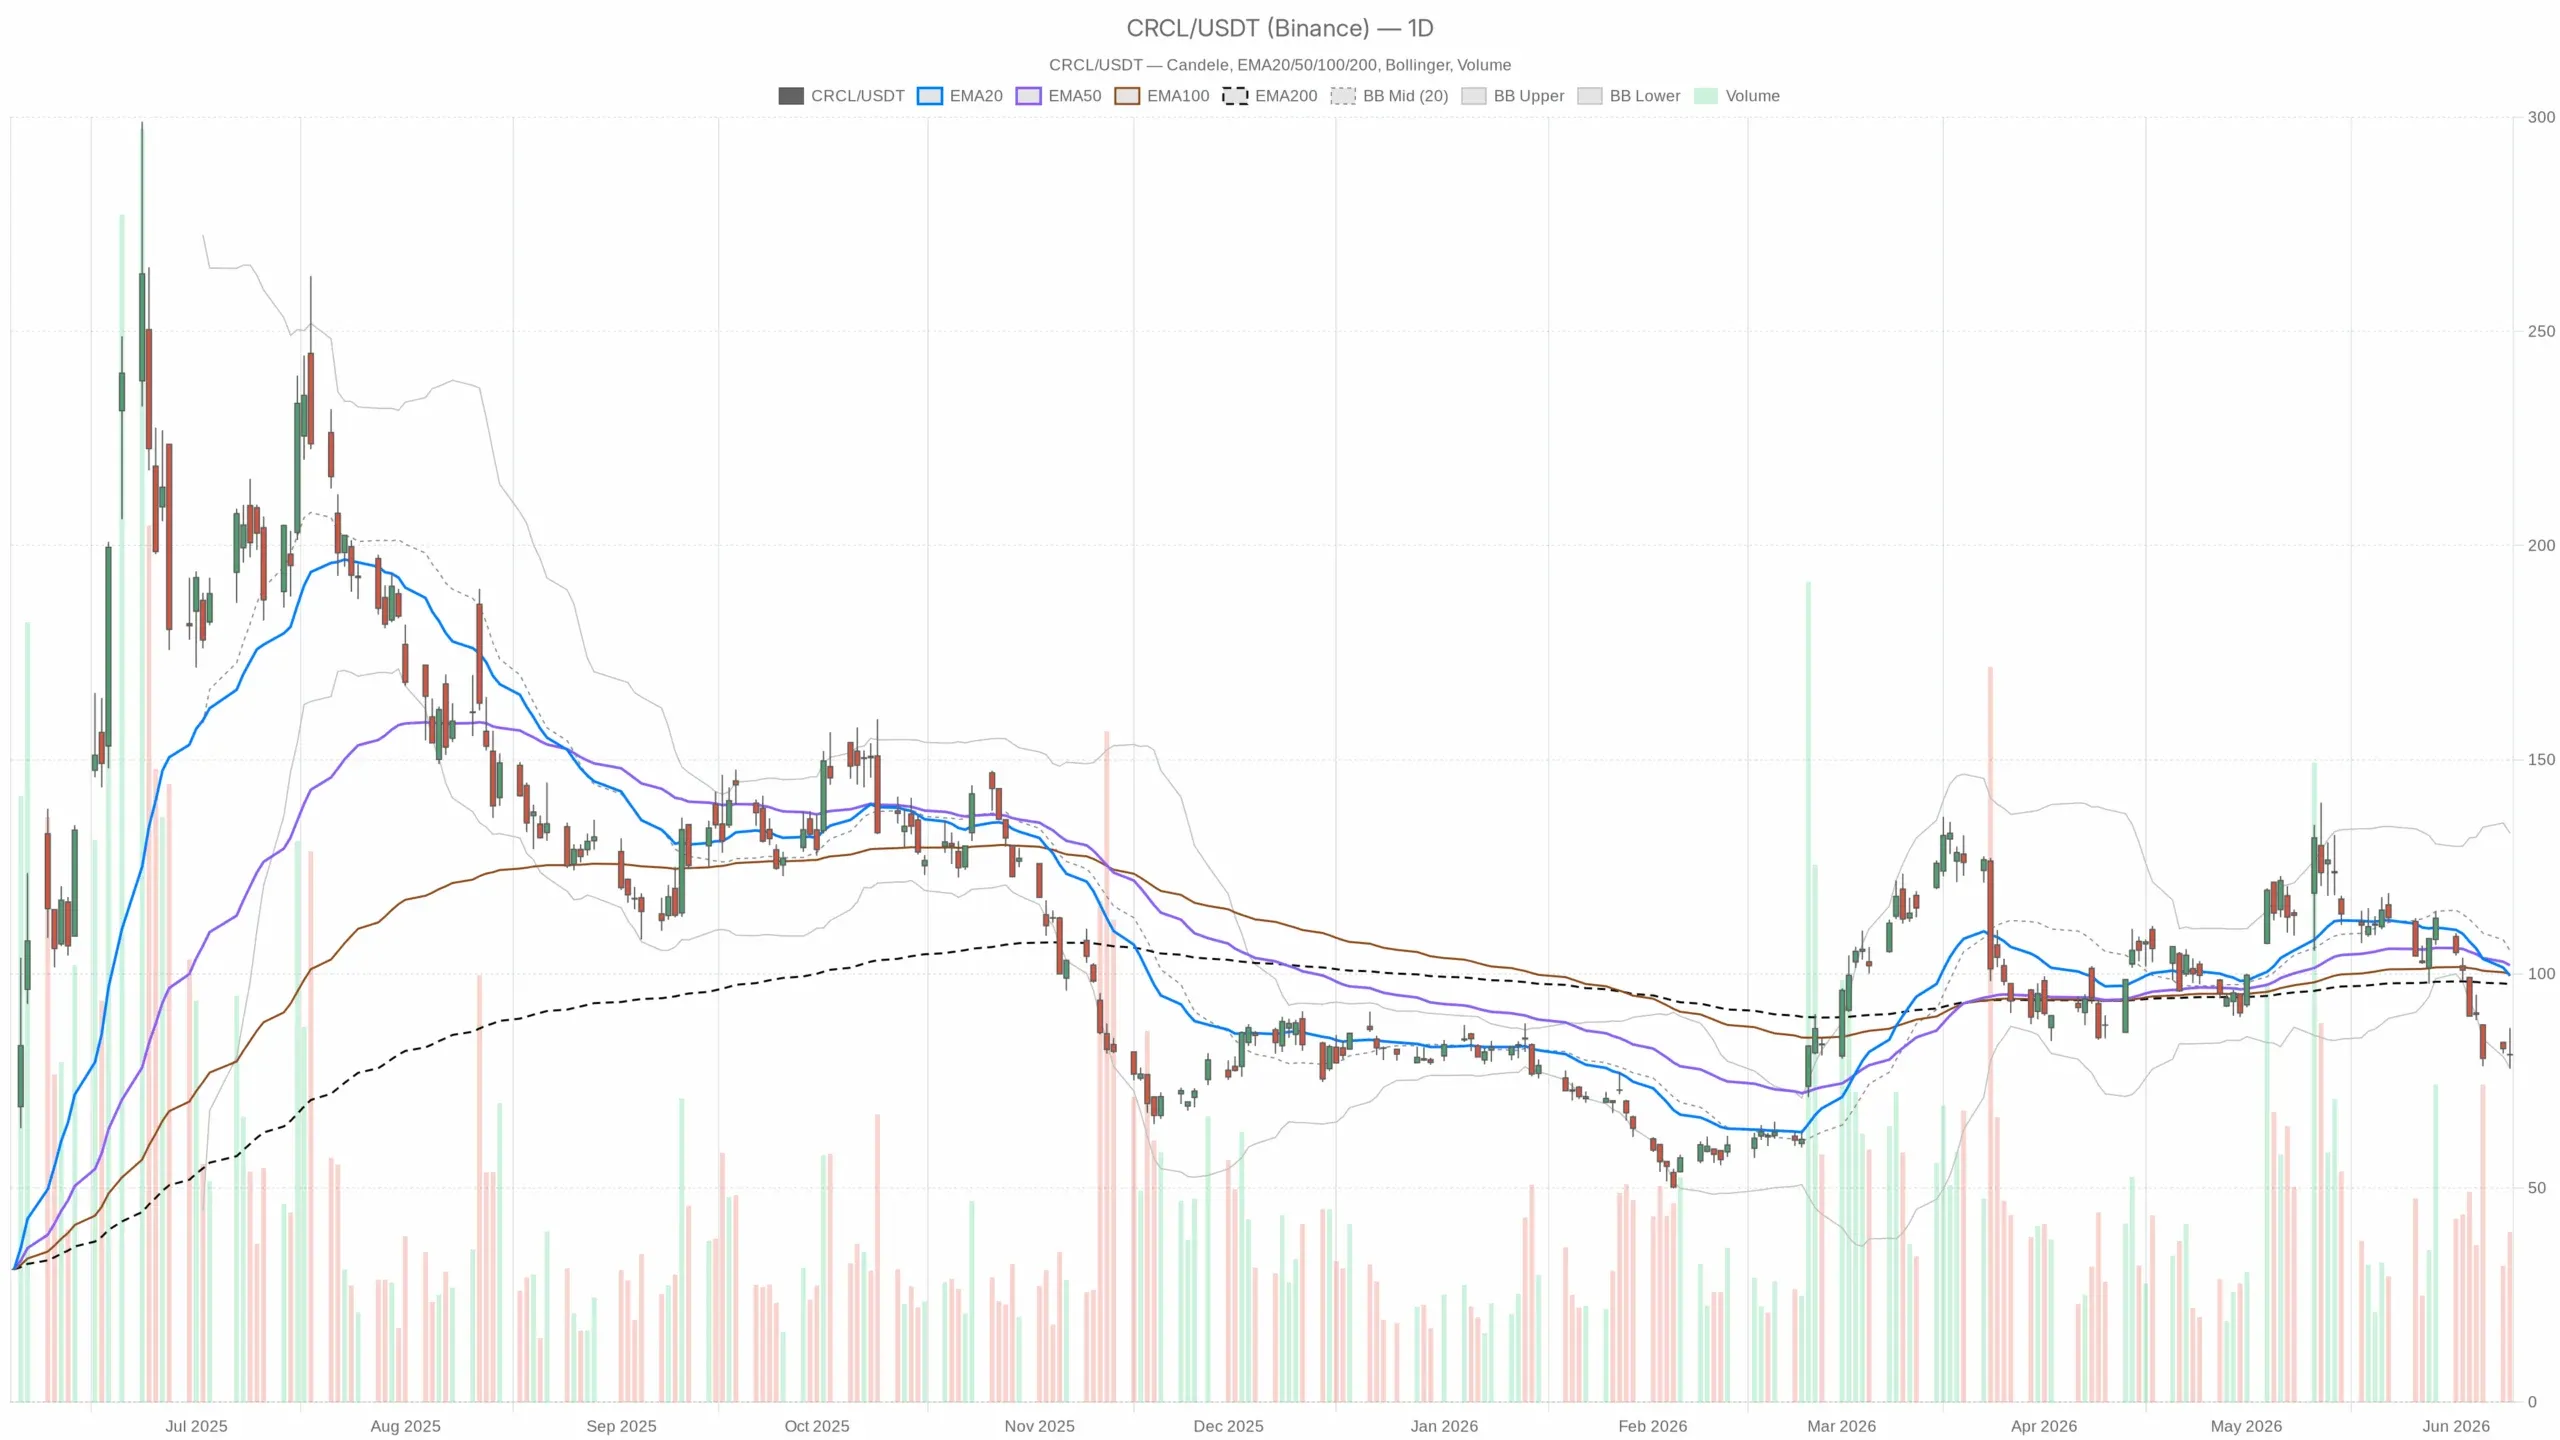
Circle Stock (CRCL) trades around $81, deep below all major moving averages. Momentum indicators point south. A structural breakdown predates recent competitive headlines. A new rival stablecoin platform backed by Visa, Mastercard, and Stripe intensifies selling pressure on an already-broken chart. CRCL — daily chart with candlesticks, EMA20/EMA50 and volume.Circle Stock (CRCL) Technical Structure: Distribution DeepensDaily Moving Averages Confirm Sustained Selling Pressure Circle Stock closed at $81.10on June 9. Price sits well beneath the EMA20 at $99.54, the EMA50 at $101.99, and the EMA200 at $97.60. This full stack of declining averages above price signals sustained distribution. The Bollinger Band midline at $105.43 confirms how extended the downside move has become. Currently, price presses against the lower band at $78.06. That offers near-term support context, but no reversal signal yet. Momentum Indicators Show No Stabilization Daily RSI at 34.31approaches oversold territory but has not crossed below 30. Oversold readings near that threshold can precede technical bounces. However, in genuinely weak trends, RSI can remain depressed for extended periods without meaningful recovery. The MACD tells a more urgent story. The MACD line sits at -6.43, well below the signal at -2.67. The histogram deepens at -3.76. No bullish divergence or momentum stabilization is visible at