Fed Rate Hike Odds Fall to 50/50: Will Bitcoin's Rally Above 80,000 Hold?
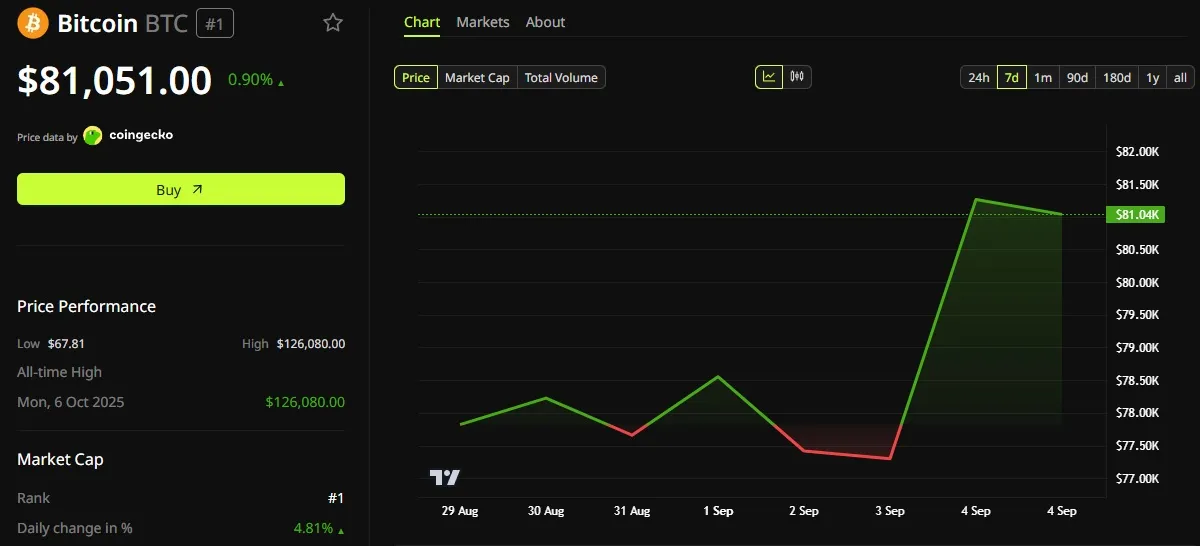
Odds of a September Federal Reserve rate hike fell back to a coin-flip on Friday, a sharp reversal after the probability touched 70% just a day earlier and sat as low as 37% a week before that. The swing tracks a rally that has pushed Bitcoin (BTC) toward $82,000. Rate Bets Whipsaw Ahead of the September Meeting The CME Group (Chicago Mercantile Exchange) FedWatch tool now shows the September 16 meeting split almost evenly between holding the benchmark rate at 3.50-3.75% and lifting it a quarter point to 3.75-4.00%. Odds of a rate hike in September dropped today, returning to a 50/50 split. The second expected rate hike is now not fully priced in until March rather than December. This represents a notable shift away from the strong hawkishness expressed by the markets earlier this week. pic.twitter.com/VVuLawauDt — Satoshi Stacker (@StackerSatoshi) September 3, 2026 The tool had assigned the hike a 70% probability as recently as Thursday. The FedWatch data also pushed back the timeline for a second hike. A move to the 4.00-4.25% range isnt priced as the most likely outcome until the March 2027 meeting. Rather than December 2026 as futures had implied earlier in the week. Iran and Oil Are Driving the Volatility The odds have