

As of July 22, 2026, the Ripple price sits at $1.13, caught between technical levels compressing the range to a breaking point. This is not consolidation built on strength but a sideways drift born of a genuine stalemate between buyers and sellers.
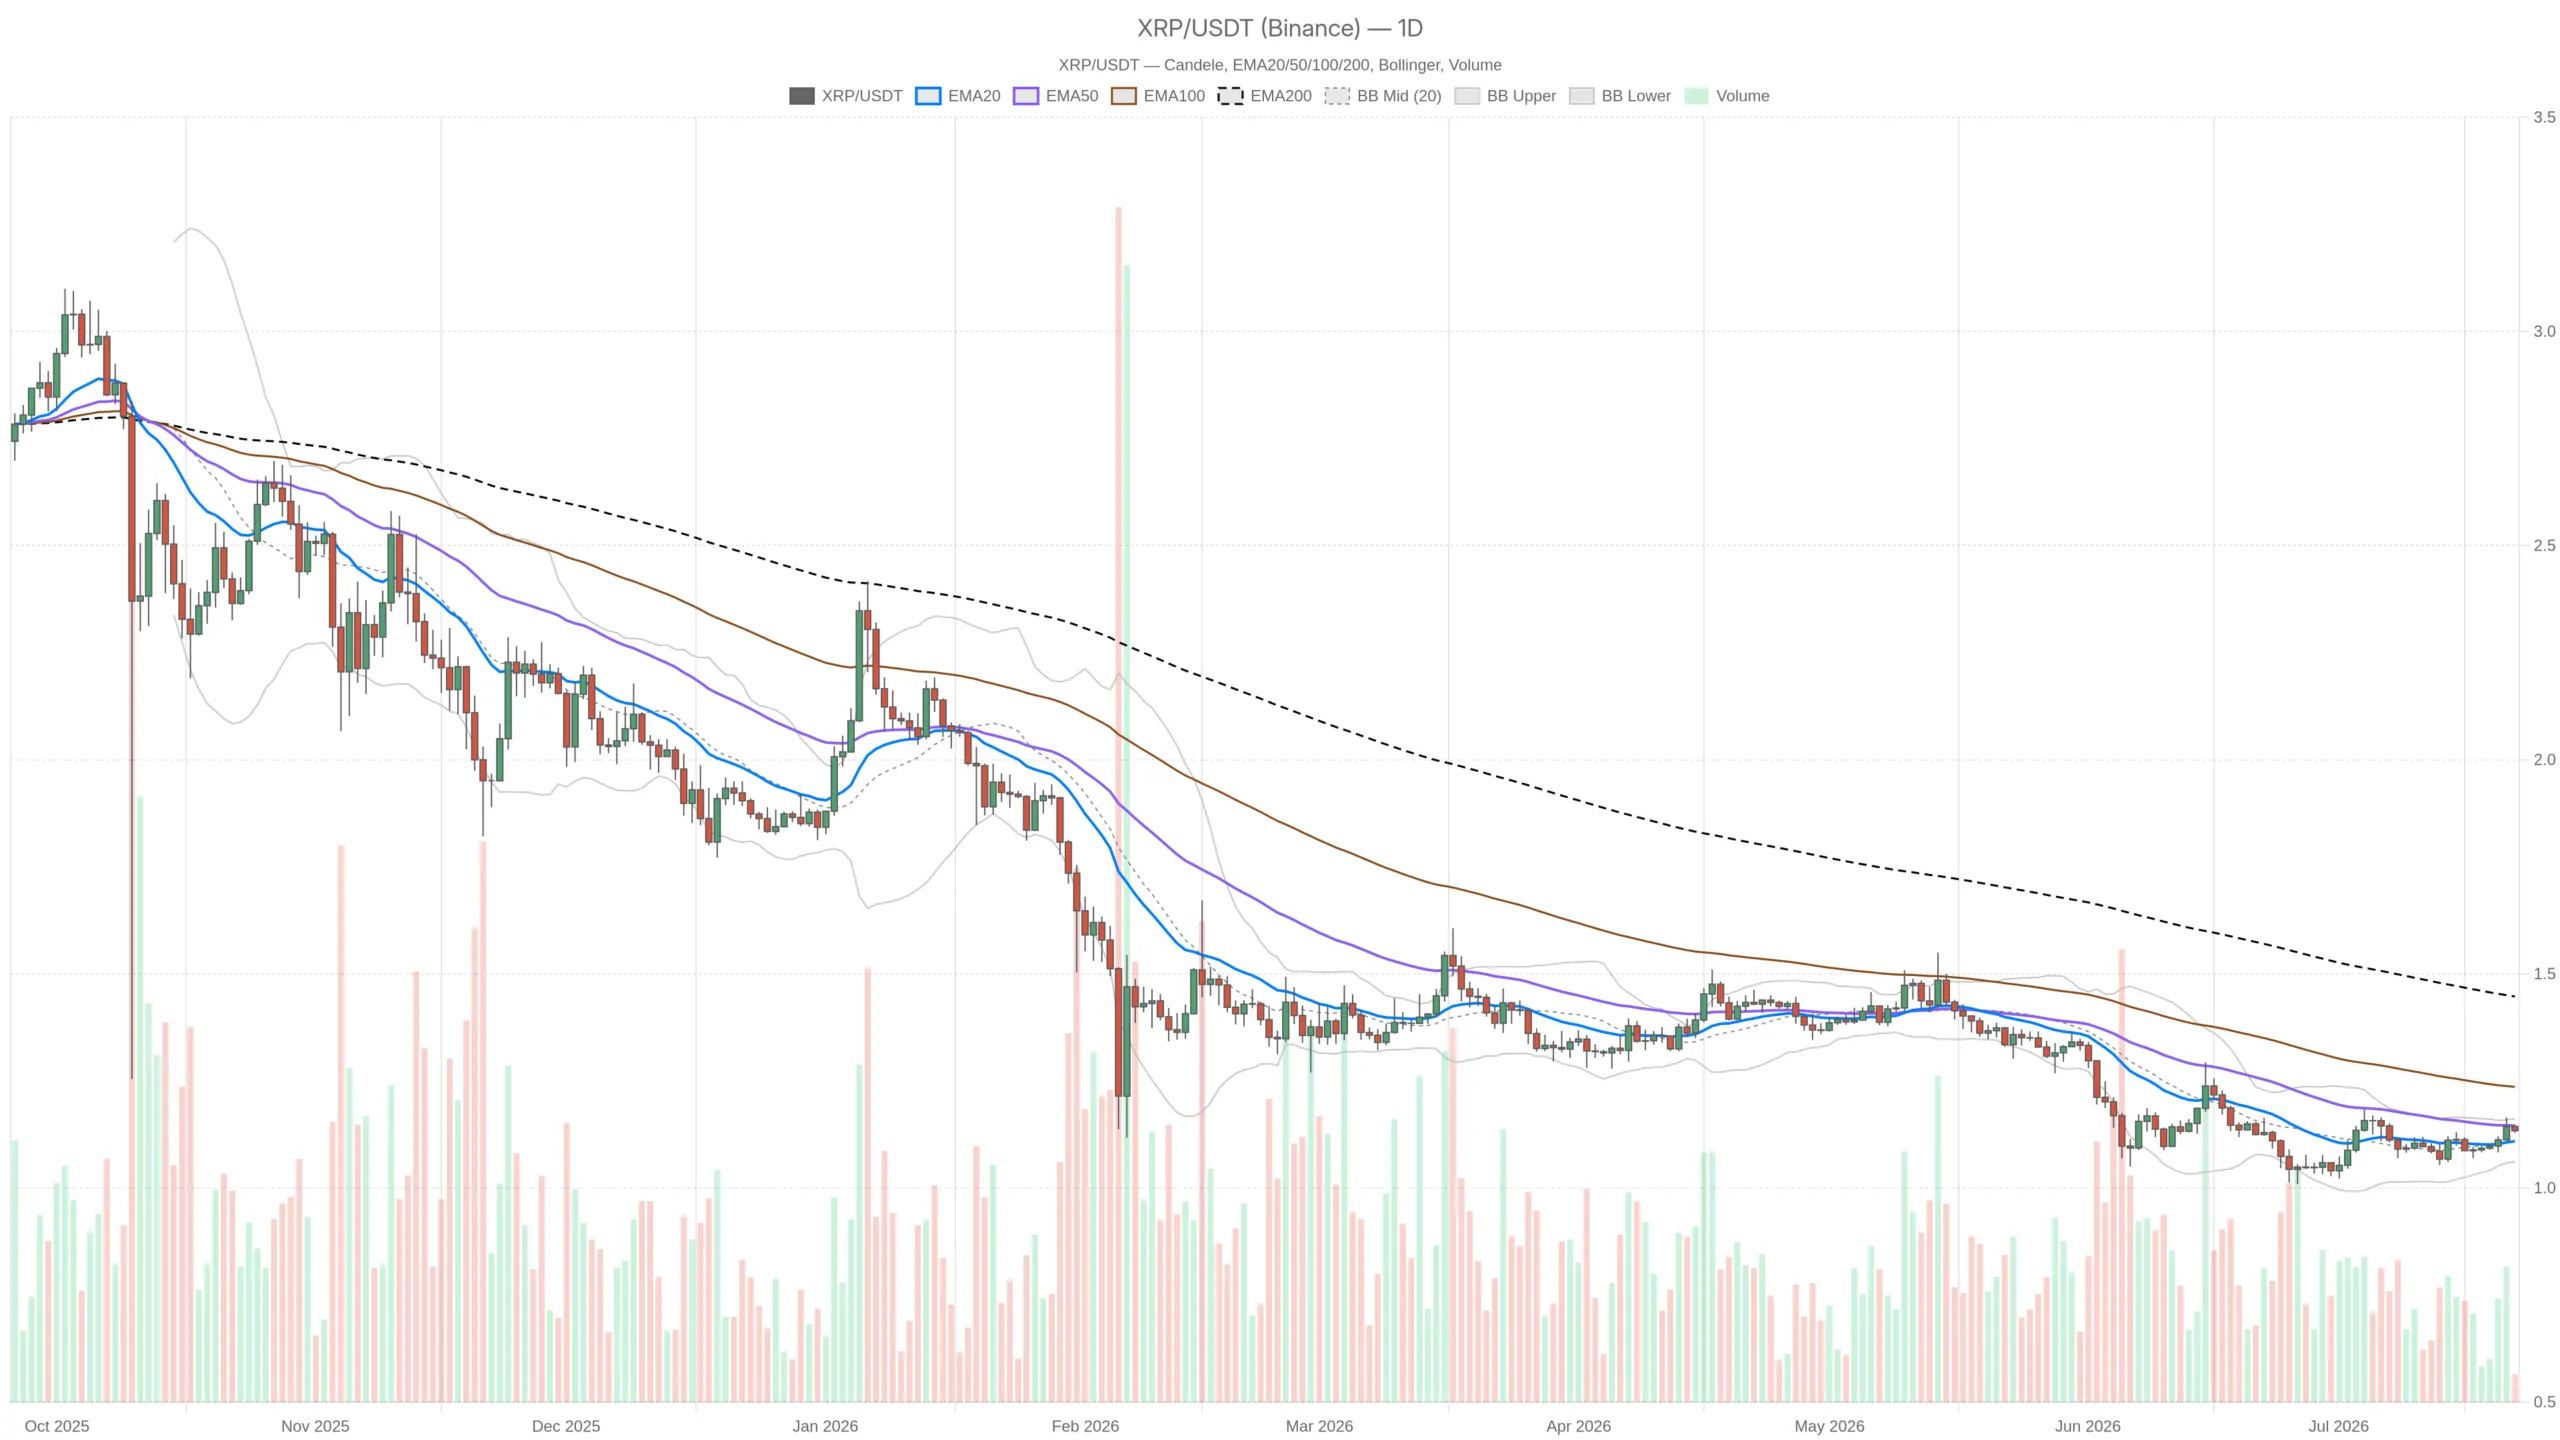
$XRP/$USDT — daily chart with candlesticks, EMA20/EMA50 and volume.Key takeaways
- $XRP/$USDT is trading at $1.13, pinned between the daily EMA20 at $1.11 and the EMA50 at $1.15.
- The Fear & Greed indexreads 33, reflecting cautious sentiment that mirrors the lack of directional conviction in price action.
- Daily RSI at 54.71and a near-zero MACD confirm a neutral regime with no clear momentum bias.
- The pivot range has compressed to just one centbetween $1.13 and $1.14, signaling an imminent expansion in volatility.
- A daily close above $1.15or below $1.11will likely determine the next directional move.
The daily chart shows a market trapped between two EMAs
$XRP is structurally ambiguous on the daily timeframe. Price at $1.13 sits above the EMA20 at $1.11 — providing near-term dynamic support — but below the EMA50 at $1.15, and that positioning reveals the full story. The asset has reclaimed its short-term trend average but has not managed the follow-through needed to retake the medium-term moving average. The EMA200 looms at $1.45, a level that feels distant from where $XRP trades today. Until price navigates above $1.15, the medium-term bias should be treated as structurally cautious.
Moreover, the daily RSI at 54.71 is middling in the truest sense. It sits above 50, which nominally favors buyers, but it has not shown the kind of sustained momentum that builds trend conviction. There is no overbought pressure and no oversold setup — just a flat read mirroring the price action. The MACD is effectively zeroed out: the line at 0, the signal at -0.01, and the histogram at +0.01. That histogram flipping fractionally positive is technically a crossover, but calling it a buy signal would be generous. Selling pressure has exhausted itself without buyers meaningfully stepping in.
Meanwhile, Bollinger Bands place the midline at $1.11, the upper band at $1.16, and the lower band at $1.06. $XRP in the upper half of the range is mildly constructive, but the upper band and the EMA50 are stacked on top of each other — creating a ceiling that will take real volume to crack. The daily ATR of $0.03 confirms that volatility has dried up significantly. Three-cent daily ranges on a $1.13 asset represent a coil, not a trend.
Intraday signals tilt modestly more cautious
Drop to the hourly and the short-term picture leans slightly bearish relative to the dailys neutral read. Price at $1.13 trades below the 1H EMA20 at $1.14 and right at the EMA50 at $1.13, while the EMA200 at $1.11 sits below as a support shelf. Notably, the fact that price cannot hold above its hourly EMA20 is a minor red flag: near-term momentum has not been able to sustain even modest recoveries toward that $1.14 area.
The 1H RSI at 46has crossed below the midline, reinforcing that intraday momentum is leaning defensive. The MACD on this timeframe is flat across the board — line, signal, and histogram all at zero — which effectively means the hourly is in no-mans-land. Bollinger Bands narrow the active range between $1.13 and $1.16, with $1.13 acting as the lower band. $XRP is hugging the floor of its hourly Bollinger range, and that is not where strong assets trade.
There is a clear tension between the daily and the hourly. The daily RSI above 50 and the marginal MACD histogram tick suggest the macro structure is holding together. However, the hourly RSI below 50 and price sitting at the lower edge of its range suggest the path of least resistance intraday is sideways-to-lower. These timeframes do not agree, and that disagreement is precisely why this market is difficult to trade right now.
The 15-minute chart offers no actionable signal
The 15-minute view provides almost no useful information. RSI at 42.25is drifting lower in sub-50 territory, the MACD is completely flat, and the ATR rounds to essentially zero — meaning intraday volatility has collapsed to the point where this timeframe is more noise than signal. The only useful observation is that short-term EMAs at $1.14 sit above price, which keeps execution bias cautious for anyone attempting long entries at current levels. For now, the 15-minute is useful only as confirmation once higher timeframes resolve direction.
Pivot levels confirm extreme compression
The daily pivot structure is almost comically compressed. The pivot point sits at $1.14, R1 at $1.14, and S1 at $1.13 — a range of just one cent between the pivot cluster and current support. On the hourly, the picture is identical: PP at $1.13, R1 at $1.14, S1 at $1.13. In short, these levels reinforce the compression thesis. The market is trading in a one-cent channel, and until one side breaks with conviction, pivot analysis offers limited edge.
Bullish and bearish scenarios for the next move
The bullish case hinges on $XRP clearing the $1.14–$1.15zone, which combines the hourly EMA20, the daily EMA50, and the daily Bollinger upper band into a single resistance cluster. A daily close above $1.15 backed by expanding volume would signal that buyers have absorbed the overhead supply and reclaimed the medium-term trend. From there, the upper Bollinger band area near $1.16 would be the first target, with a longer-term eye toward the $1.25–$1.30 area if momentum builds. What would kill this scenario: a failure to hold $1.11, which is both the daily EMA20 and the Bollinger midline.
The bearish case is straightforward. If compression resolves to the downside — which the hourly RSI below 50 and the Fear & Greed reading of 33both marginally support — then $1.11 becomes the first real test. A clean break below that level on a daily close would put the daily Bollinger lower band at $1.06 in play. Below $1.06, limited technical structure exists until the $1.00psychological level. A sustained reclaim of $1.14–$1.15 on volume would invalidate the bear thesis, suggesting the dip below the EMA20 was a liquidity grab rather than a breakdown.
Positioning and risk in a low-volatility environment
The honest read is that $XRP is not a market to force. The daily, hourly, and 15-minute regimes are all flagged as neutral — three timeframes, one word. With ATR compressed across every frame and the Fear & Greed index at 33, this is a market that rewards patience over aggression. Ultimately, the next meaningful move will likely be decided by broader crypto sentiment. If Bitcoin dominance at 56.74% begins to fade and risk appetite returns, $XRP has the structure to push toward $1.15 and potentially higher. If the total market cap continues its mild deterioration, the Ripple price remains vulnerable to testing lower support levels.
That said, anyone considering a position should be clear-eyed about one thing: in a one-cent pivot range with zero ATR on the 15-minute chart, stop placement is nearly impossible without accepting very tight risk or waiting for the range to expand. The compression will break — it always does — but right now the market is asking traders to respect the ambiguity rather than bet against it. Size accordingly, define your level, and let price show its hand first.