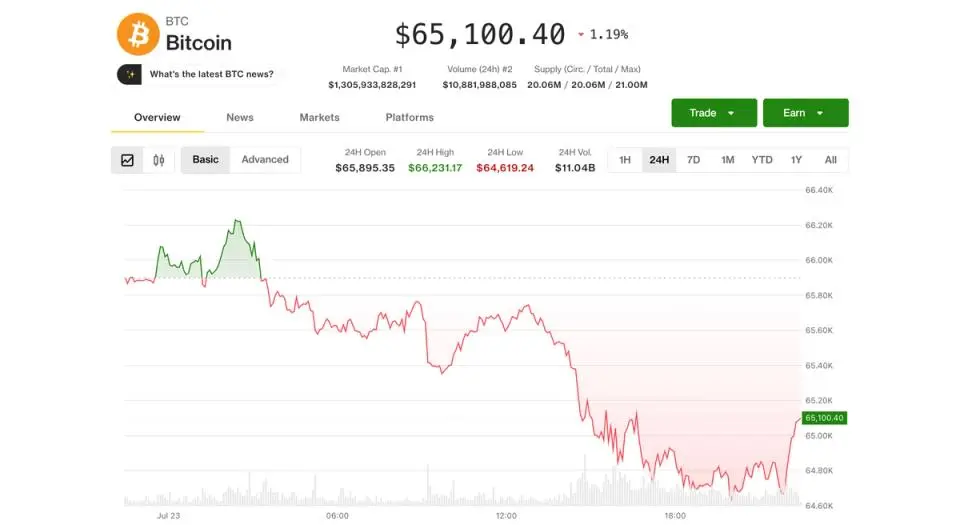
Mises à jour en direct : Dogecoin et ether en tête du recul alors que les investisseurs digèrent les résultats technologiques
Linflation au Japon saccélère alors que le rendement des obligations à 10 ans dépasse 2,8 % Le taux dinflation global annuel du Japon a accéléré à 1,7 % en juin, contre 1,5 % le mois précédent, atteignant ainsi son niveau le plus élevé depuis décembre. Linflation de base, qui exclut les aliments et lénergie, est passée à 1,6 % contre 1,4 %. Cependant, ces deux indicateurs restent inférieurs à lobjectif de 2 % fixé par la Banque du Japon, où ils se maintiennent depuis le début de 2026. Cependant, les obligations gouvernementales japonaises ont continué à se vendre, poussant le rendement à 10 ans au-dessus de 2,8 %, en hausse de plus dun point de pourcentage au cours des dernières 24 heures.
07-24Industrie