




In brief
- CoinGlass showed $1.05 billion in liquidations across its tracked markets over 24 hours; 88.2% came from long positions.
- Bitcoin fell as low as $74,780.91, its weakest intraday price since August 21.
- Bitcoin's 50-day average price remains above the 200-day, but the charts suggest a building bearish trend.
Bitcoin is trading near $75,570 on Friday after touching $74,780.91 today; its lowest intraday reading since August 21, 77 days earlier.
The crypto market retreat followed a brutal selloff in AI stocks and another round of forced closures in derivatives markets.
According to CoinGlass data, $1.05 billion in crypto have been liquidated over the preceding 24 hours. Long positions, which profit when prices rise, accounted for $930.04 million, or 88.2%, compared with $124.69 million in shorts.

Predict·CryptoBTC Lows in November
55,0003%YesNo
57,5005%YesNo
60,0008%YesNo
62,50012%YesNo
65,00020%YesNo
+5 more outcomes+4 more outcomes
NEW
$5.68 volume
Dec 1Closes: Dec 1, 2026, 04:59 UTC
Closes: Dec 1, 2026, 04:59 UTC
That 80%-20% gap in liquidations also matches the overall sentiment tracked by the Fear and Greed Index which is set at 28 points (approaching extreme fear) out of 100, where 0 is a state of maximum fear among traders, and 100 is maximum greed. For context, the index was at a neutral just a week ago, before the midterm elections.
Bitcoin accounted for $267.20 million of the total, with 88.9% from long positions, while Ethereum recorded $167.14 million, 81.1% of it long.
Liquidation happens when an exchange automatically closes a position because its collateral is no longer sufficient, sometimes adding selling pressure to an existing decline. Unlike normal trading, in which investors can handle any unrealized loss, trading with leverage gives a maneuver window that can end in the loss of all funds once an asset goes beyond or below a specific price.
AI stocks plunge, then recover some ground
The post-midterm election fear is spreading on Wall Street, and U.S. technology stocks took the first big hit on Thursday. The Nasdaq Composite fell 5.52%, its worst session in 19 months, while the Philadelphia semiconductor index plunged more than 12% and Nvidia alone lost over 9%.
Democratic victories in Tuesday's midterm elections raised concerns that tougher AI regulation could slow construction of the data centers behind this year's chip rally. The S&P 500 lost 4.36% on Thursday, erasing roughly $3 trillion in market value across its constituent companies.

BitcoinBTC · USD
$75,799−1.81%
24H7D1M1YYTD
Oct 30Nov 1Nov 3Nov 4Nov 6
$80.7k$79.0k$77.3k$75.5k
24h HighHigh$76,449
24h LowLow$74,921
VolVol$1.5B

→
Buy Bitcoin with USDC
Powered by Jupiter
$50$100$500
Buy
Price data by CoinGeckoCoinGeckoMore Bitcoin news and projections →
Bitcoin had already given back its post-election relief rally as chipmakers sank, as Decrypt reported Thursday. Forced closures of bullish crypto positions accelerated the fall, though simultaneous moves in stocks and tokens doesnt necessarily mean the equity rout alone caused Bitcoin's decline.
A stronger-than-expected U.S. October jobs report also increased expectations of another Federal Reserve rate hike in December. Higher borrowing costs can weigh on speculative markets, leaving crypto exposed even as chip shares recover.
Bitcoin price: What the charts say
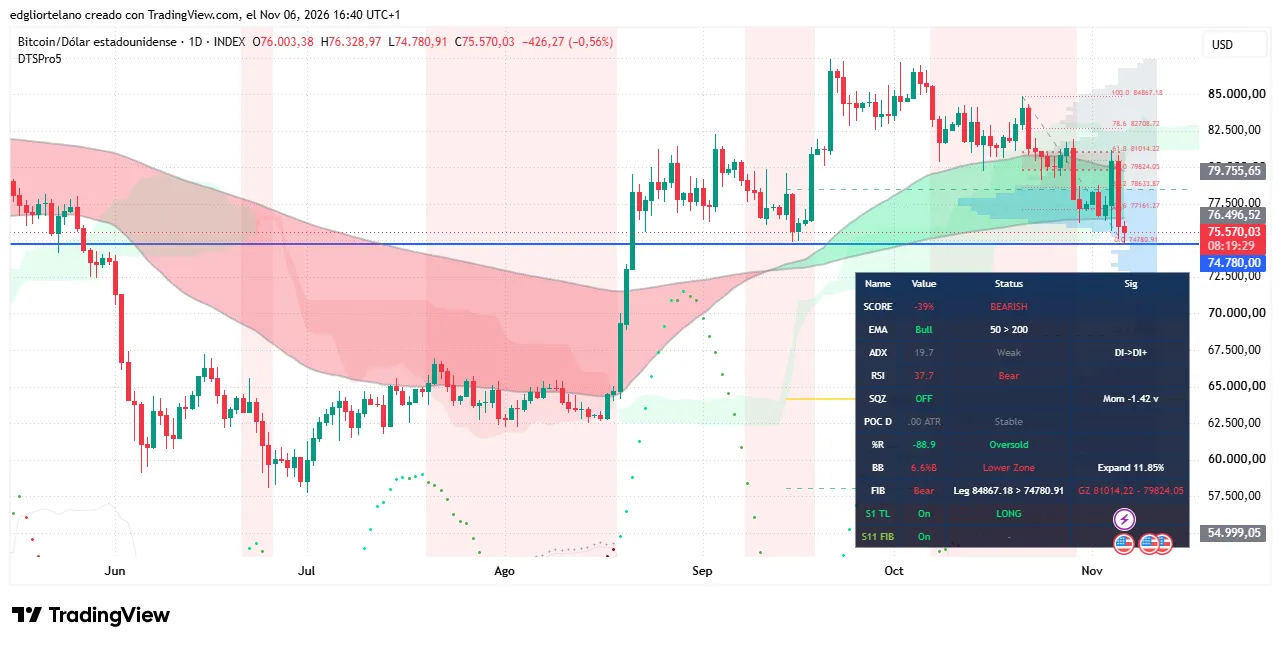
Right now, Bitcoin trades near $75,570, with the current candle still forming after a low of $74,780.91. The weekly chart shows another red candle and a sequence of lower highs since September, when Bitcoin briefly traded above $87,000.
The 50-day exponential moving average, or EMA, gives more weight to recent prices and sits near $79,756, above the 200-day EMA around $76,497. That ordering remains bullish on a longer view, but Bitcoin is now trading below both averages, a sign the latest decline has overtaken the lagging bullish signal.
The Relative Strength Index, or RSI, reads 37.7, below the neutral 50 mark but still above the 30 level generally considered oversold. The Average Directional Index, or ADX, is at 19.7, typical of trendless states—but the negative directional indicator exceeds the positive one, pointing to weak but bearish directional pressure.
The immediate support is $74,780, the horizontal line and intraday low on the supplied chart. A daily close below it would shift attention toward the $73,000 to $72,500 area around August's breakout, followed by the psychological $70,000 level if that zone fails.
On a recovery, Bitcoin first faces the 200-day EMA near $76,497, then some weak and immediate near $80,000. Friday's daily candle is still open, with its $74,780.91 low the immediate level to defend.
Disclaimer
The views and opinions expressed by the author are for informational purposes only and do not constitute financial, investment, or other advice.
Daily Debrief Newsletter
Start every day with the top news stories right now, plus original features, a podcast, videos and more.
Email addressJoin free
Join 72,000+ readers
Create an account to save your articles.
Add on Google
Add Decrypt as your preferred source to see more of our stories on Google.