






Bitcoins price hovered around $82,550 to $83,000 on Monday, Oct. 12, 2026, as technical indicators painted a largely neutral picture with a modest bearish tilt. The cryptocurrency traded within a 24-hour range of $82,550 to $84,231, while repeated failures to reclaim $84,000 kept bullish momentum in check. Despite near-term weakness, bitcoin remains above several longer-term moving averages, suggesting its broader recovery structure is still intact.
Key Takeaways
- Bitcoins price trades near $82,550 and $83,000 as neutral indicators and weakening momentum give bears a slight advantage.
- Bitcoin faces resistance around $84,000 to $85,000, while $82,500 remains an important support level.
- Bitcoins longer-term moving averages remain positive despite short-term uncertainty and fading momentum.
Bitcoin Price Stalls Near $83K as Bears Test Markets Resolve
Bitcoins price is caught in a technical tug-of-war, hovering around $83,000 on Monday, Oct. 12, 2026, as short-term weakness clashes with a longer-term recovery that has yet to unravel.
With a market capitalization near $1.673 trillion and approximately $23 billion in daily trading volume, bitcoin has struggled to establish momentum above $84,000, leaving traders to decipher a mixed collection of technical signals that favor neither side decisively, although recent price action gives bears a modest advantage heading into the next potential directional move.
Bitcoins Hourly Chart Shows Momentum Fading
The one-hour chart reveals a market struggling to regain its footing after retreating from a local high of $84,254. A succession of lower highs and bearish candles pushed bitcoin toward $83,000, although declining trading volume suggests the downward pressure has yet to develop into a convincing breakdown.
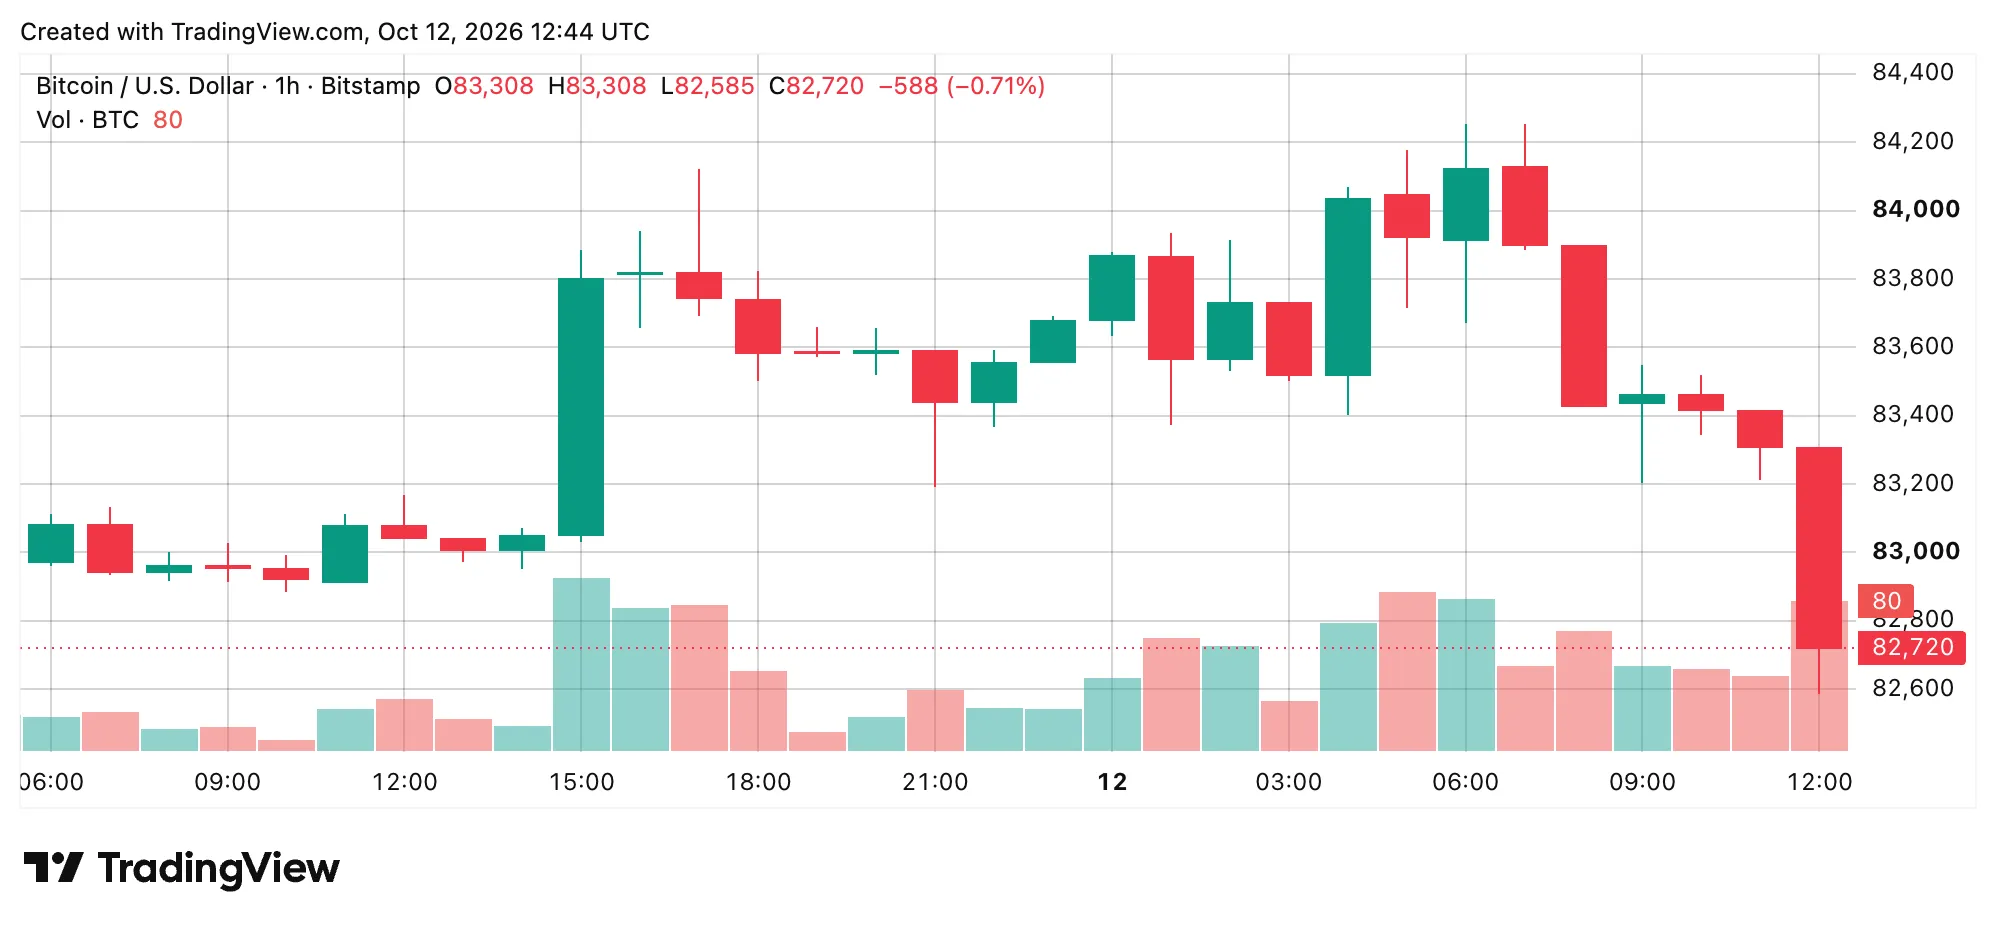
BTC/USD 1-hour chart via Bitstamp on Oct. 12, 2026.
Immediate support rests between $82,700 and $83,000, where a bullish reversal would improve the outlook. Resistance appears near $83,500, followed by $84,000 and $84,254. Losing $82,700 would expose $82,250 and potentially $81,800.
Four-Hour Recovery Encounters Resistance
The four-hour chart tells a similar story, although its broader structure remains somewhat more constructive. Bitcoin recovered from $80,308 and advanced toward $84,000, only to encounter repeated resistance between $83,800 and $84,000.
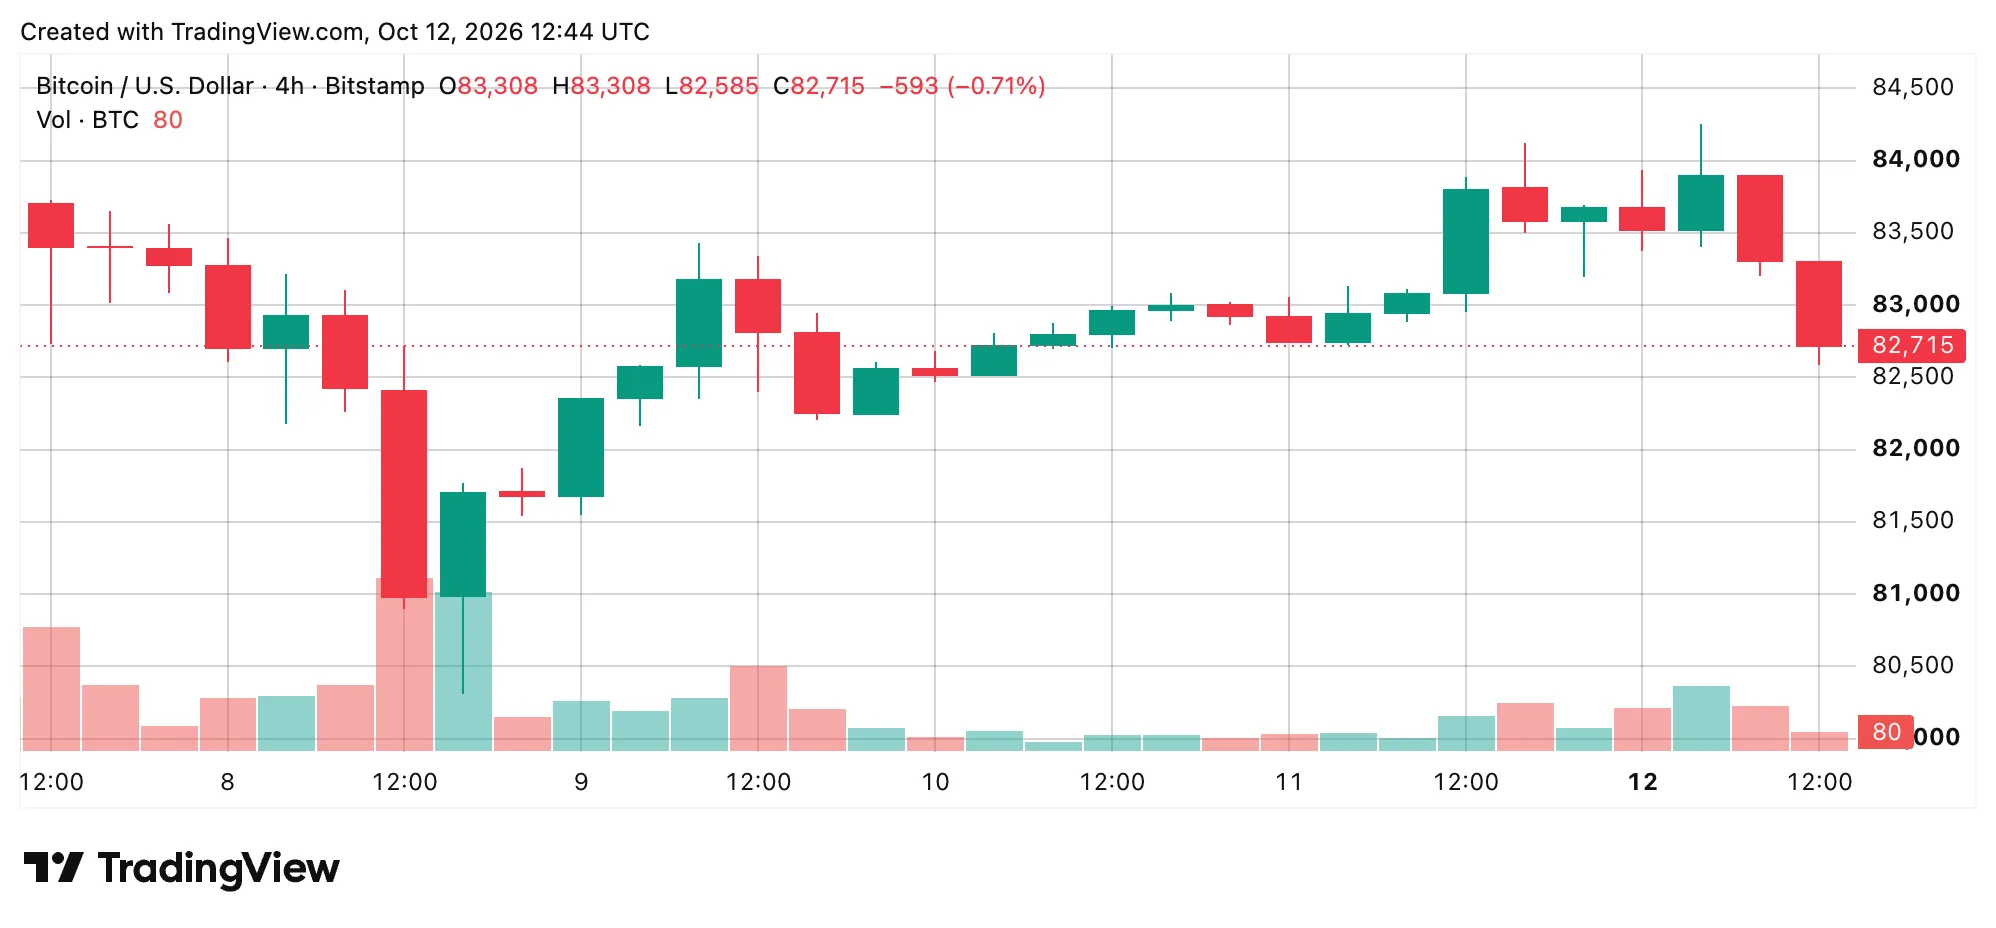
BTC/USD 4-hour chart via Bitstamp on Oct. 12, 2026.
Recent bearish candles suggest the recovery has lost momentum, but the market has not established a decisive downward trend. Support between $82,500 and $82,800 remains important, while a sustained advance beyond $84,000 would bring $84,500 and $85,000 into focus. A breakdown beneath $82,500 would shift attention toward $81,500 and eventually $80,308.
Daily Chart Keeps Broader Recovery Alive
On the daily chart, bitcoin remains comfortably above Septembers $74,913 low but below its more recent $87,374 peak. The cryptocurrency retreated from approximately $86,500 toward $80,000 before staging a recovery that has struggled to regain meaningful traction.
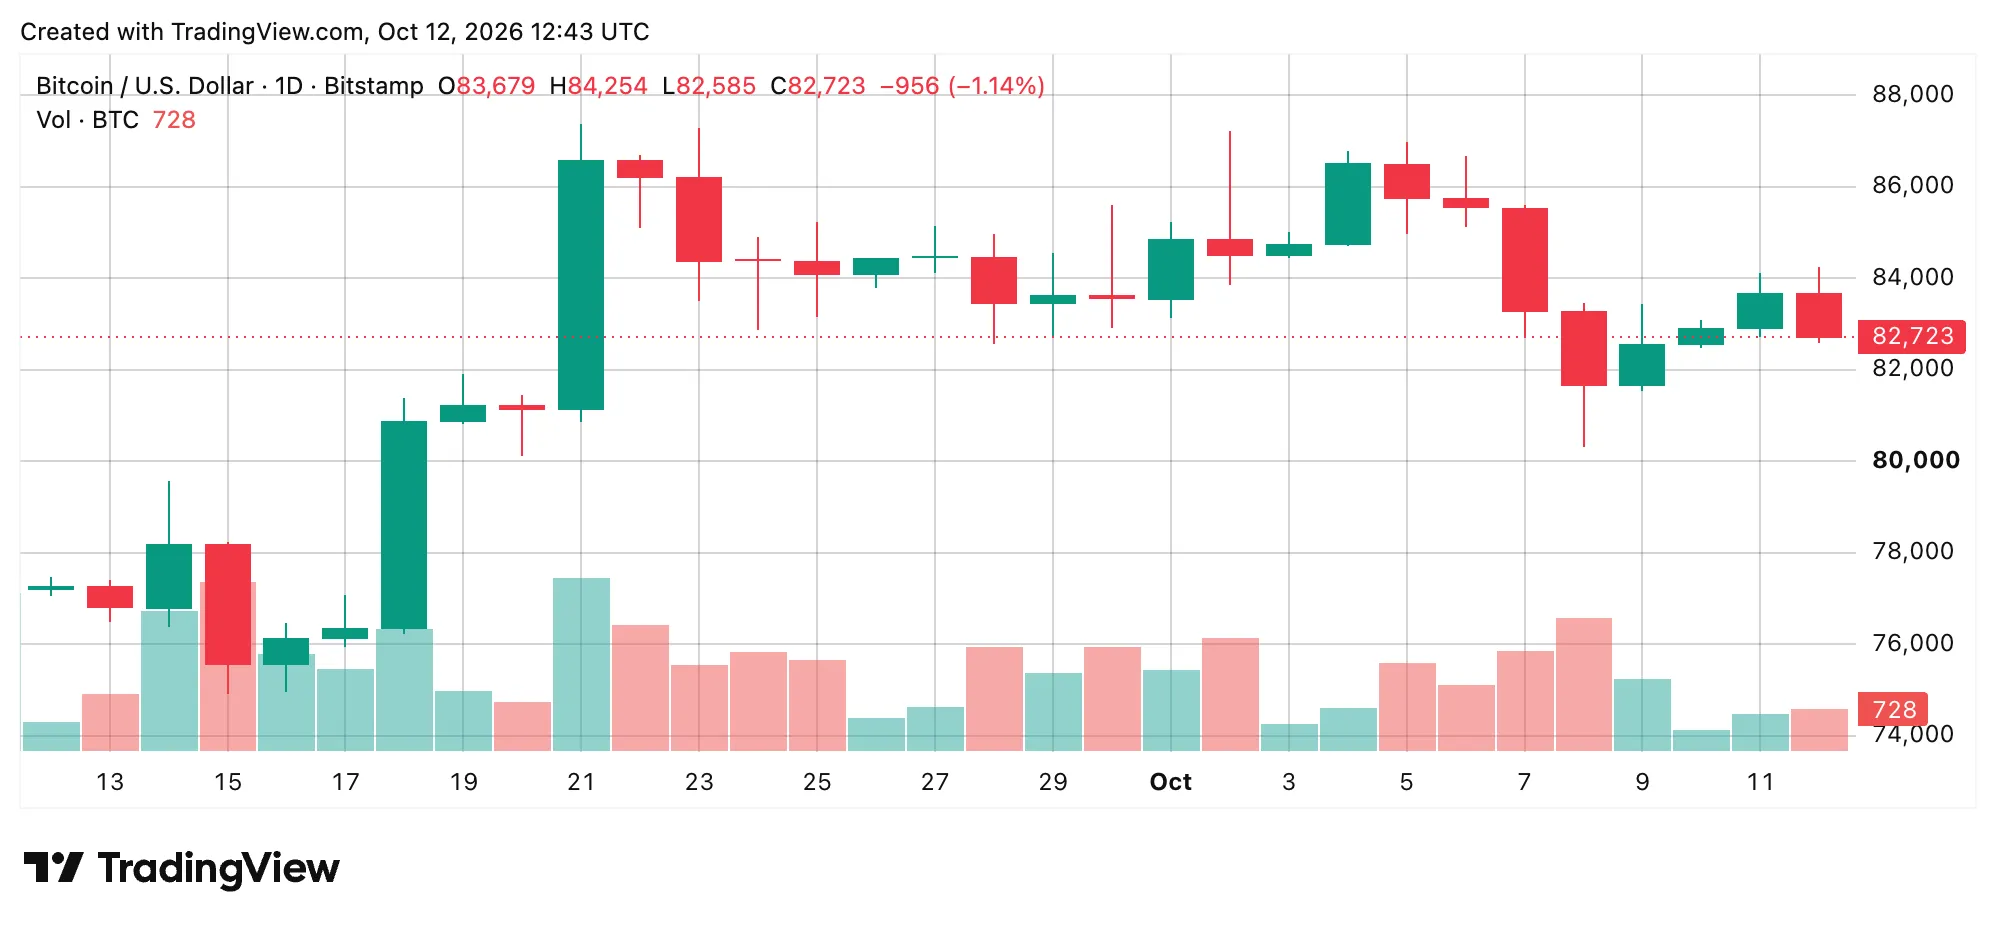
BTC/USD 24-hour chart via Bitstamp on Oct. 12, 2026.
The $80,000 to $81,000 region represents substantial support, while $84,000 to $85,000 forms the immediate resistance corridor. A daily close above $85,000 would strengthen the bullish argument and place $86,500 and $87,374 within reach. Conversely, losing $80,000 would expose $78,000 and potentially $74,913.
Oscillators Signal Indecision as Momentum Weakens
Bitcoins oscillators reinforce the neutral assessment, with eight registering neutral readings, two negative, and one positive signal. The relative strength index (RSI) stands at 51, indicating balanced momentum, while Stochastic on Monday reads 42, and the commodity channel index (CCI) registers minus 61.
The average directional index (ADX) sits at 32, suggesting an established trend without independently identifying its direction. Meanwhile, momentum registers minus 1,510 and moving average convergence divergence (MACD) stands at 797, both carrying negative signals. Bull bear power remains positive to start the week at 168, illustrating the markets conflicting technical currents.
Moving Averages Reveal Bitcoins Divided Technical Picture
The daily charts moving averages (MAs) offer a more encouraging intermediate-term perspective, with nine positive readings against five negative and one neutral. Bitcoin trades near its 20-period exponential moving average (EMA) at $83,231, while the 10-period EMA at $83,509 and 20-period simple moving average (SMA) at $84,071 present nearby obstacles.
Longer-term support remains substantial, with the 50-period EMA at $80,136 and 200-period SMA at $72,052. These readings suggest bitcoins broader recovery remains intact despite short-term hesitation, leaving the $82,500 to $84,000 corridor as the immediate battleground.
Bull verdict:
Bitcoins broader technical foundation remains constructive, particularly while prices hold above $82,500 and the longer-term moving averages. Reclaiming $84,000 would improve momentum, while a daily close above $85,000 would strengthen the case for another advance toward $87,374.