






Summary
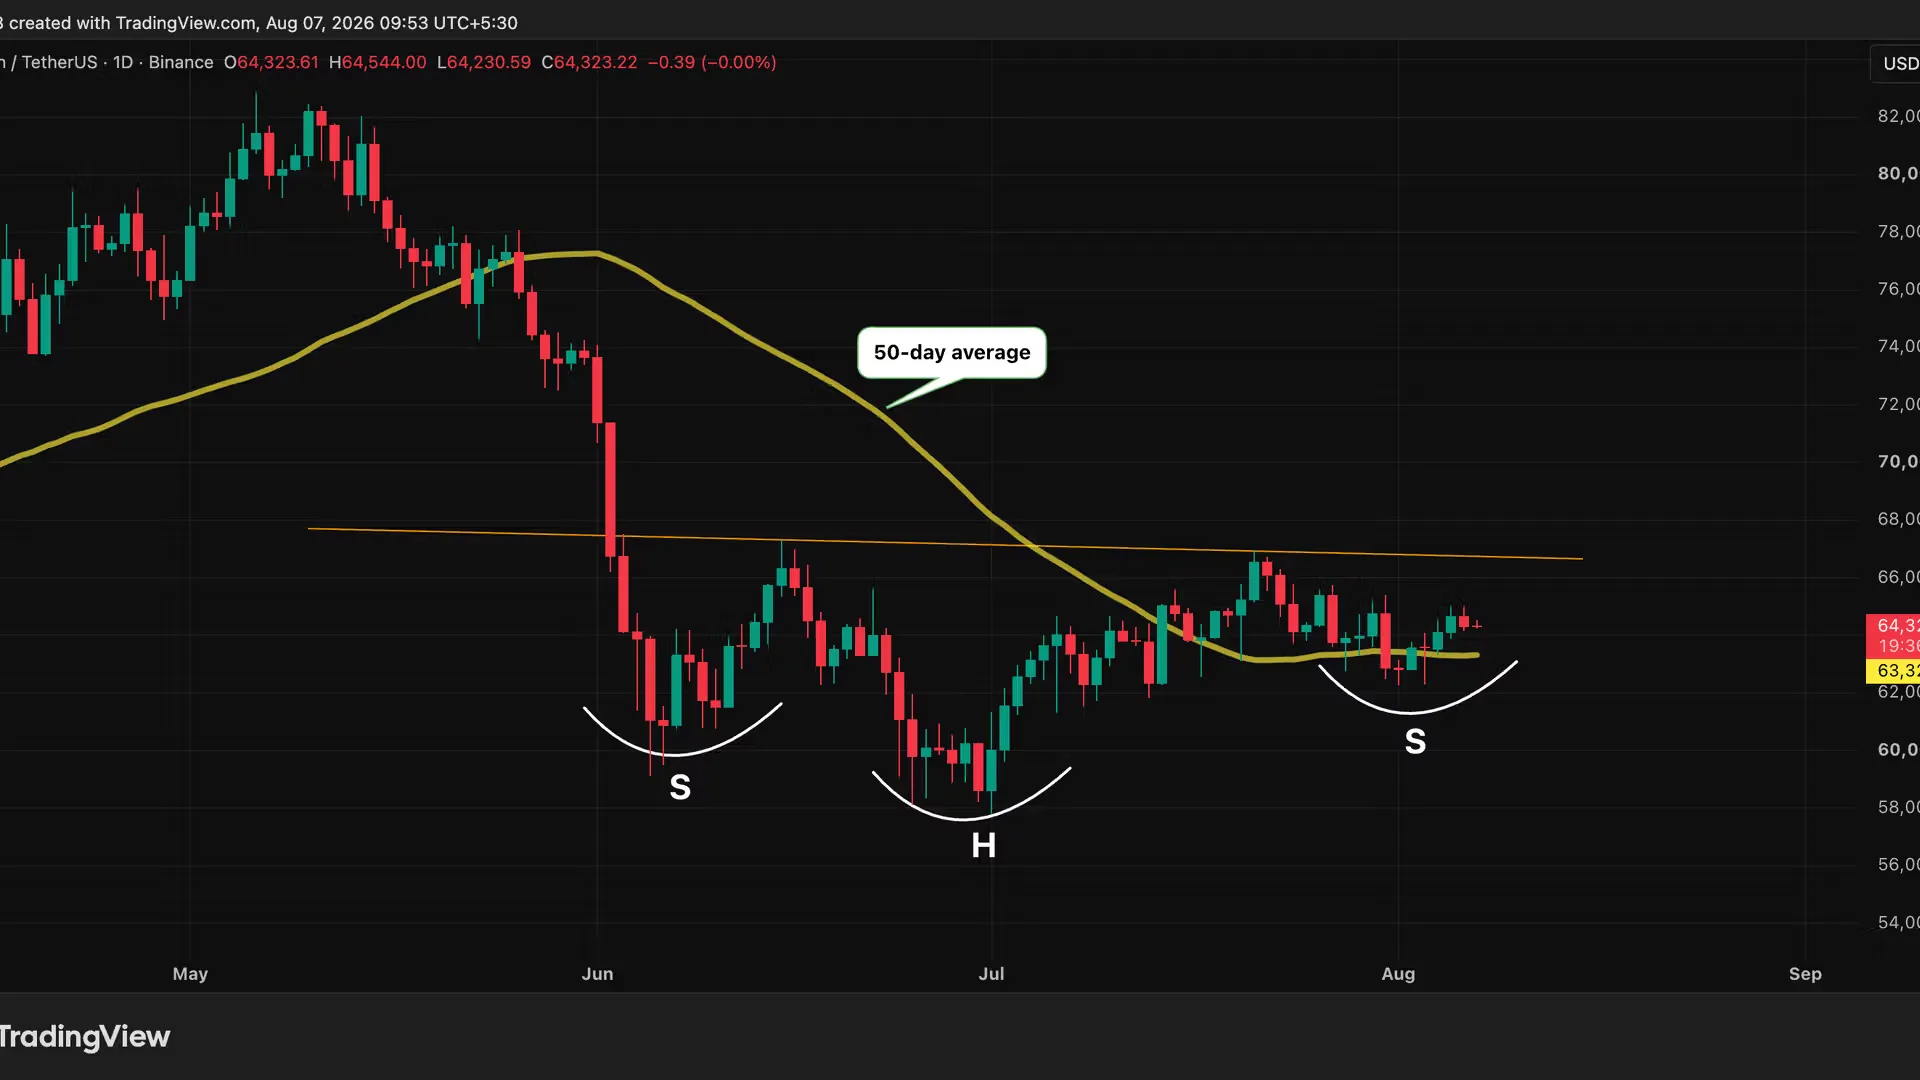
- Bitcoin's price is tracing out a potential bullish inverse head-and-shoulders patter on the daily chart.
- Prices could rise to $76,000 if the pattern is triggered.
- The pattern isnt confirmed yet. Chart reading remains subjective, and the Clarity Act uncertainty is a reason to watch for renewed weakness below the 50-day average.
Bitcoin's recent price action has been unremarkable and boring, the kind that sends traders looking for excitement elsewhere.
But look closer, through a technical analyst's lens, and the token appears to be hammering out a bullish pattern, which, if confirmed, could suggest a rally to $76,000.
That pattern is the popular inverse head-and-shoulders (H&S) setup, typically seen at the end of a downtrend rather than in the middle of one. It involves three troughs separated by temporary price recoveries. The middle trough is the deepest, marking peak bearishness or selling, while the shallower trough that follows is the first sign of seller, or downtrend, exhaustion.
A completed pattern, marked by prices rising through a line connecting the interim recoveries, called the neckline, is said to confirm a bullish trend revival.
The pattern is visible on bitcoin's daily chart: a low near $60,000 in early June formed the left shoulder, a deeper trough near $57,700 in late June or early July marked the head, and the recent bounce from around $62,500 formed the right shoulder. Each trough was followed by a rebound toward a similar resistance zone.