






XRP price trades near $1.40, down about 8% over the past week and 11% below its September 23 high.
Yet XRP holders are not rushing to sell. Coins keep leaving exchanges, and ETF buyers sitting on losses keep adding.
Exchange Outflows Are Holding Steady
Glassnodes Exchange Net Position Change tracks how much XRP left or entered exchanges over the past 30 days. A negative reading means more coins left than arrived.
Around September 25, with XRP near $1.57, the metric stood at about −1.53 billion XRP. On October 8, with XRP near $1.38, it read −1.58 billion XRP.
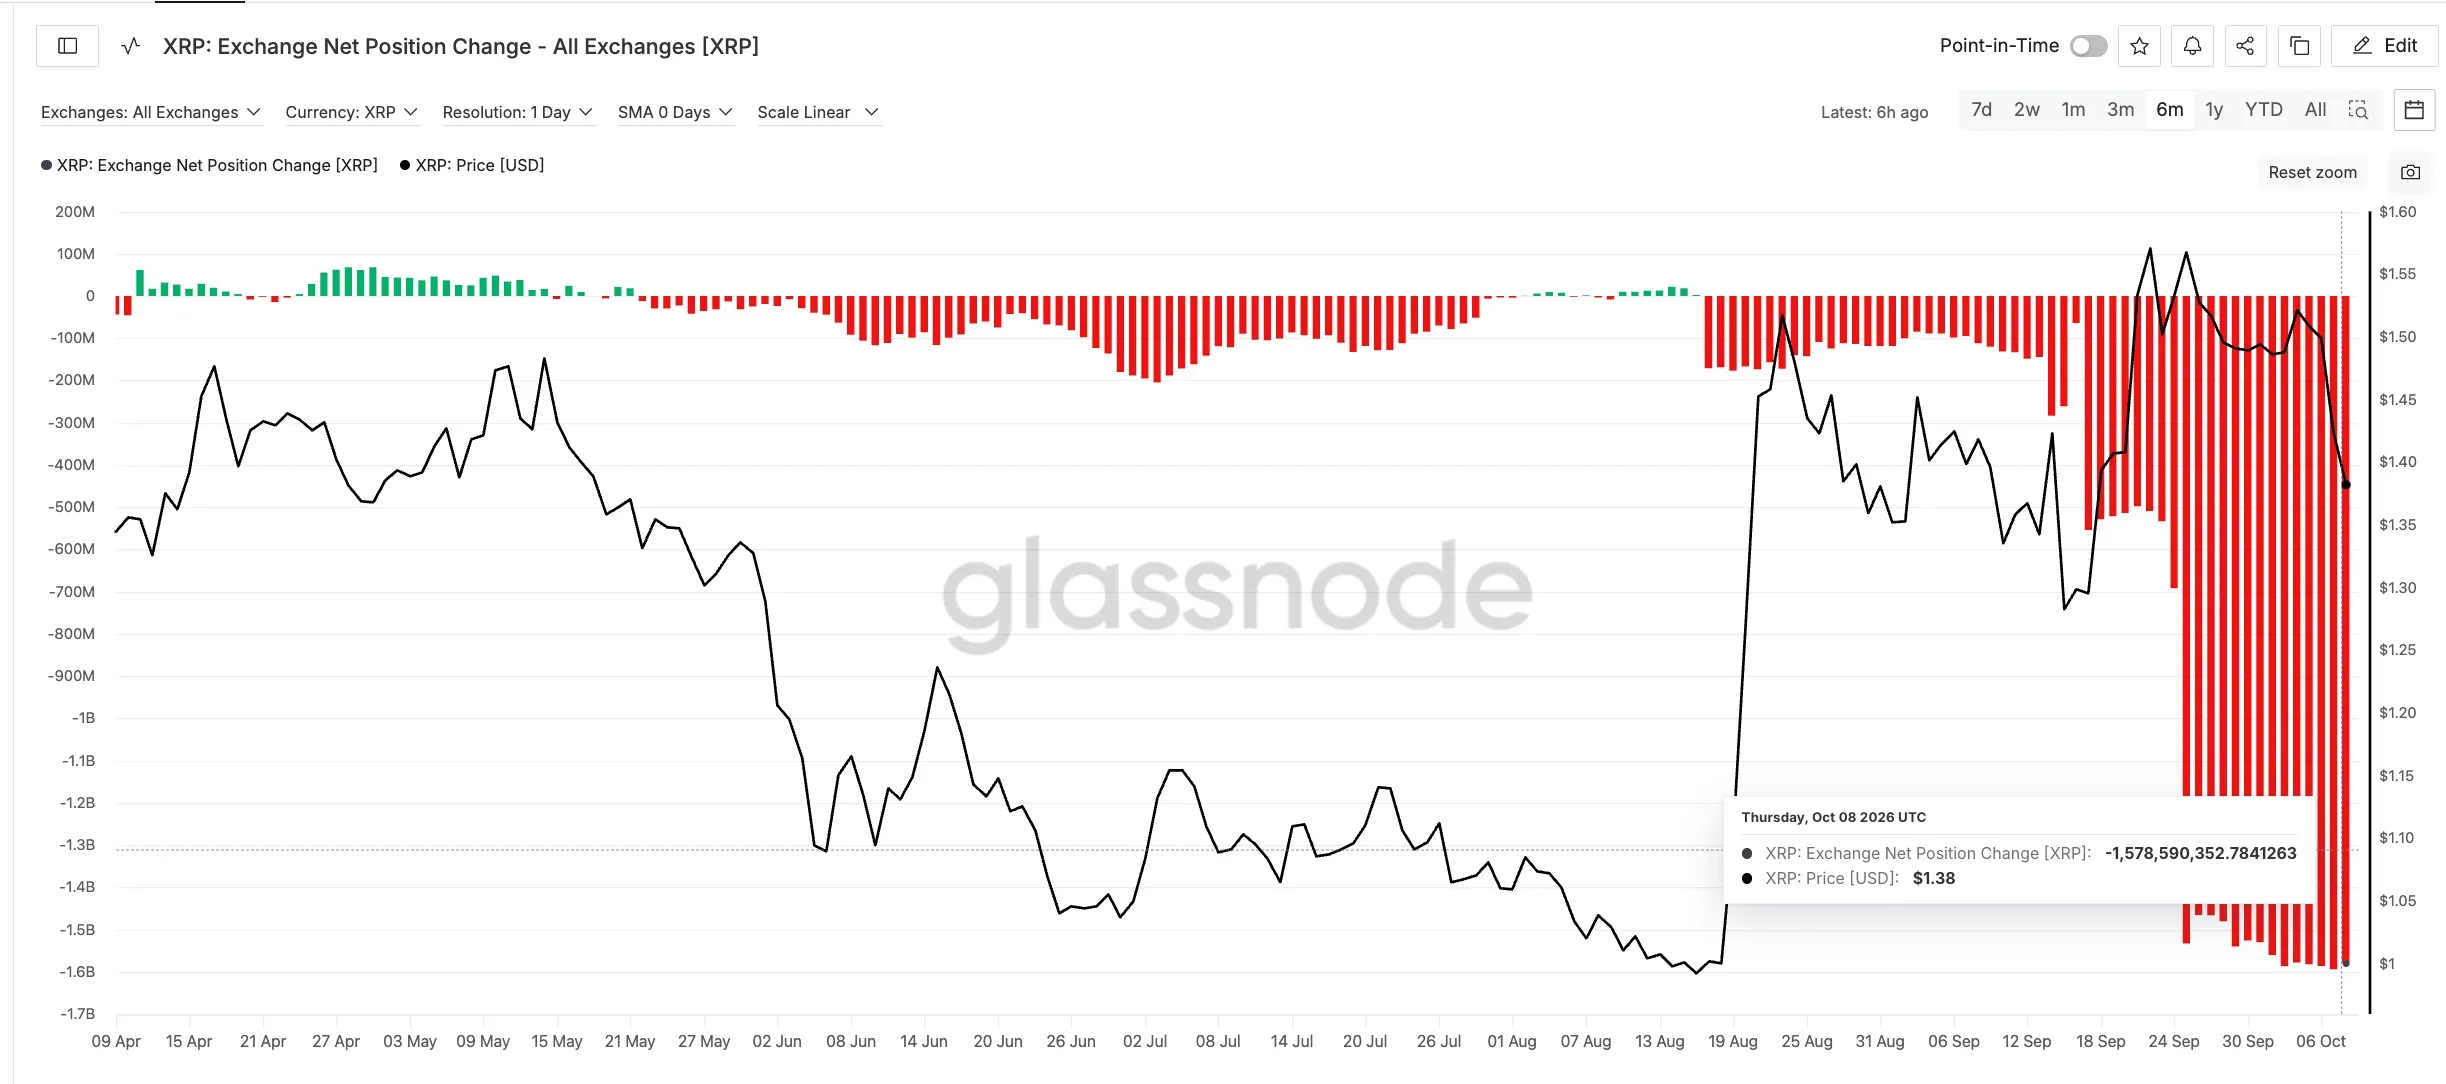
XRP Exchange Net Position Change: Glassnode
So outflows held steady through the drop. Had holders rushed to sell, deposits would have jumped and pulled the reading toward zero. That has not happened, which suggests most holders are sitting tight.
Fund buyers show the same patience.
ETF Buyers Are Underwater but Still Adding
Since launch, investors have put $1.80 billion of cash into spot XRP ETFs, per SoSoValue ETF data. Inflows even hit a 2026 record in August. The funds used that cash to buy XRP.
XRP now trades below the price paid for much of it. So on October 8, the XRP they hold was worth $1.56 billion, about 13% less than the cash put in. In Canarys XRPC, the gap is about 31%, with $335.7 million in assets against $486.8 million of inflows.
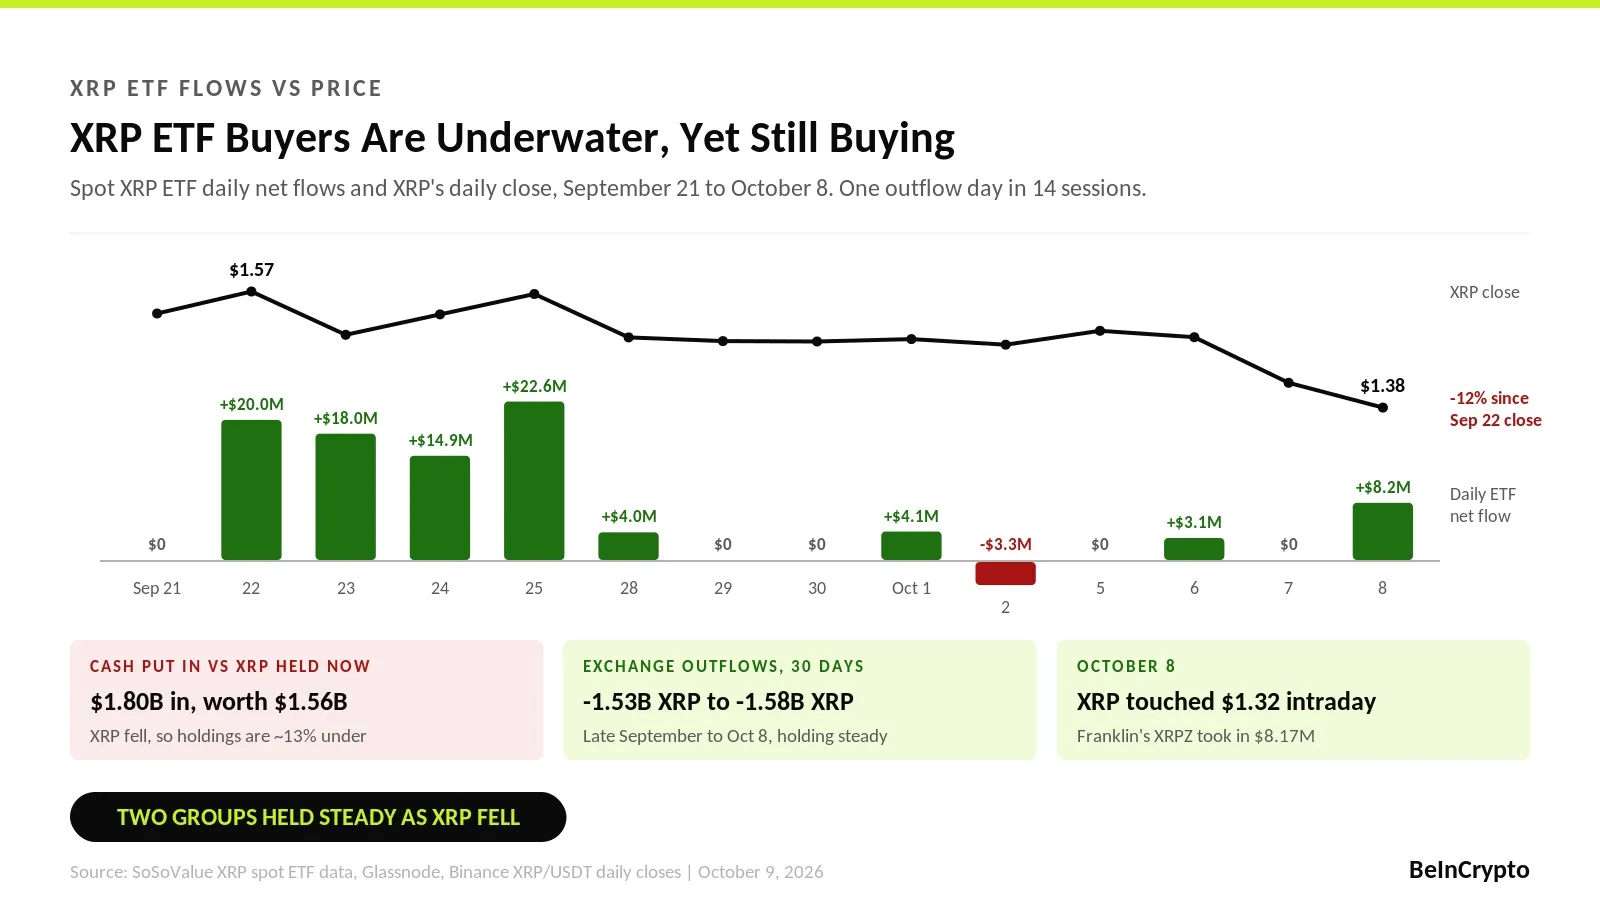
XRP ETF Buyers Are Underwater, Yet Still Buying: BeInCrypto
Underwater buyers often bail during drops. These have not. The funds logged only one outflow day since September 18, a $3.28 million exit on October 2. On October 8, as XRP dipped to $1.32 during this week‘s crypto sell-off, Franklin’s XRPZ still took in $8.17 million.
Inflows have slowed since late September but stayed positive. Over the past 30 days, the funds added less than 100 million XRP. So most of the 1.58 billion XRP that left exchanges was moved by someone other than the funds.
The chart shows where that patience gets tested.
XRP Price Levels That Will Test This Patience
XRP price has trended lower since peaking near $1.70 on August 22, after Augusts 28% rally. Its September rebound stalled at $1.65.
On October 8, XRP slipped under $1.37, the 0.618 Fibonacci level, then closed back above it. Steady outflows and ETF buying may have helped that quick reclaim.
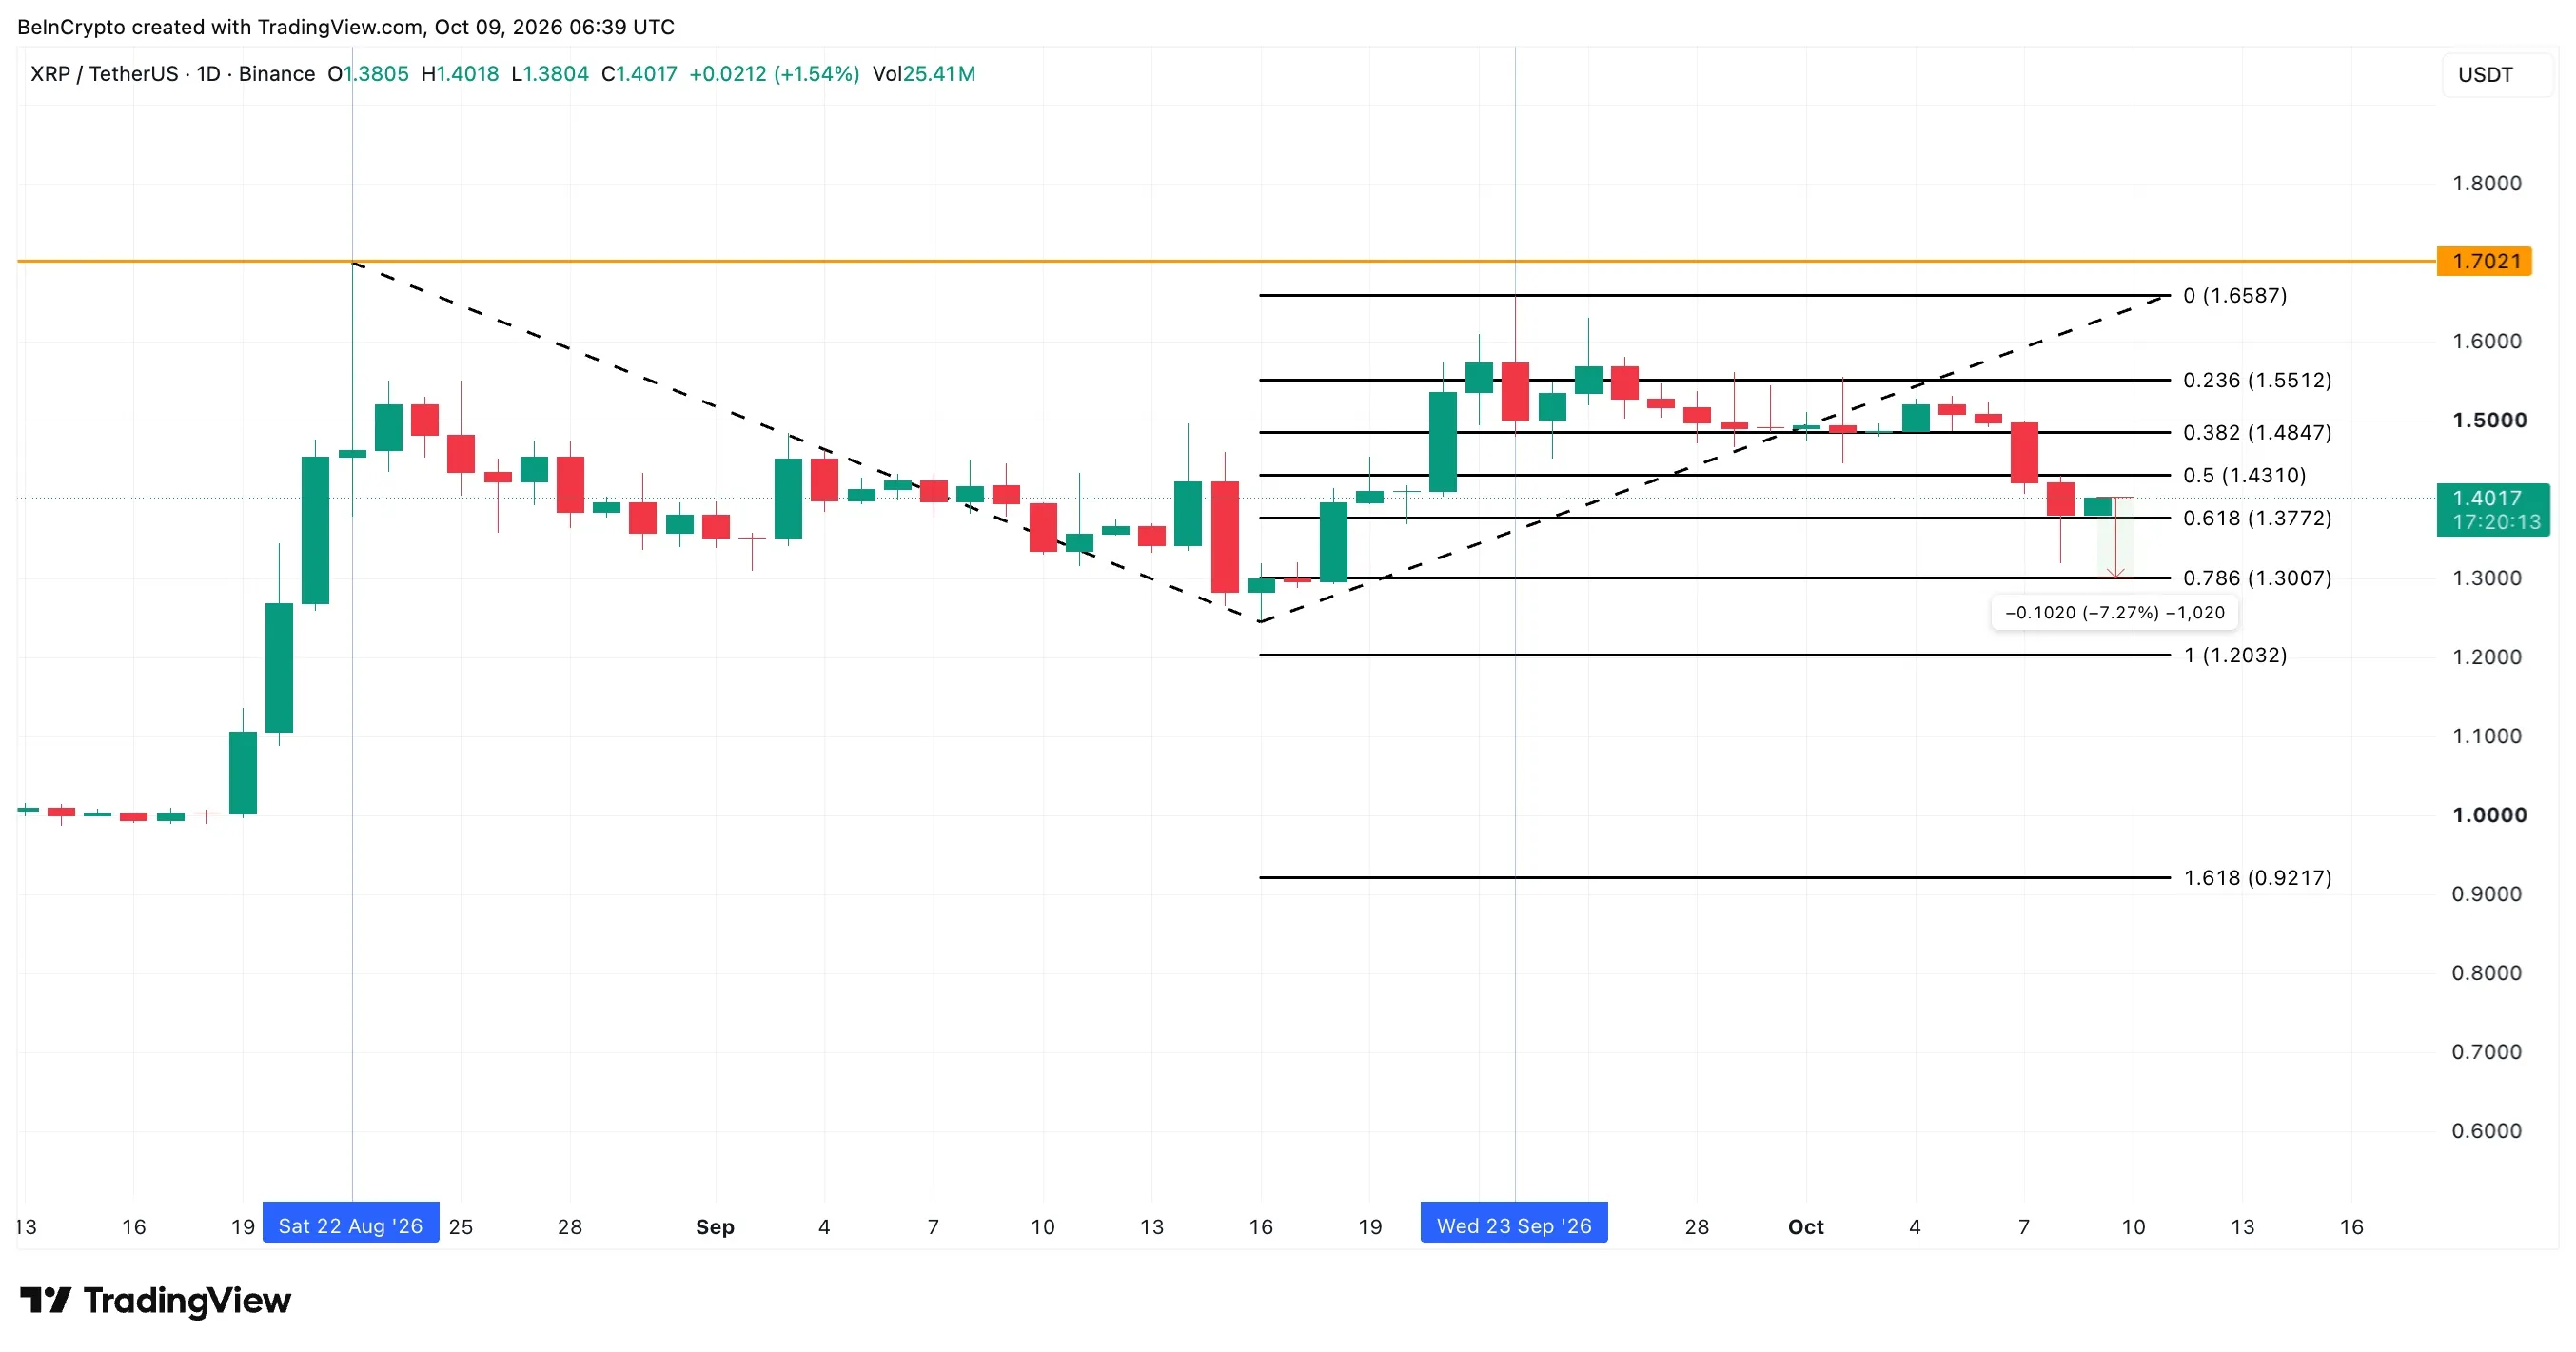
XRP Price Analysis: TradingView
Holding $1.37 keeps a push toward $1.43 and $1.48 alive. A move above $1.66 and then $1.70 would break the run of lower highs.
A daily close under $1.37, followed by a drop below $1.30, could turn patient holders into sellers. That would open $1.20, and even $0.92 if the wider market weakens.
Analysts View: Holders and ETF buyers have sat through an 8% weekly drop without selling. $1.37 separates a rebound toward $1.48 from a slide that could finally break their patience.