




This is a daily analysis by CoinDesk analyst and Chartered Market Technician Omkar Godbole.
A few days ago, CoinDesk highlighted three potential hurdles that could trip up bitcoin's (BTC) march toward $120,000, one of which was the well-established bull fatigue zone above $116,000, in place since July. Sure enough, BTC's recent bounce from lows around $107,200 has hit a wall, failing to break decisively beyond $116,000 since last Friday.
That resistance aligns closely with a key trendline connecting the bull market peaks of December 2017 and November 2021, a price ceiling that‘s capped BTC’s upside in July and August, as shown by the long upper wicks on the monthly candles. The bulls tried twice already but couldnt hold above this line.
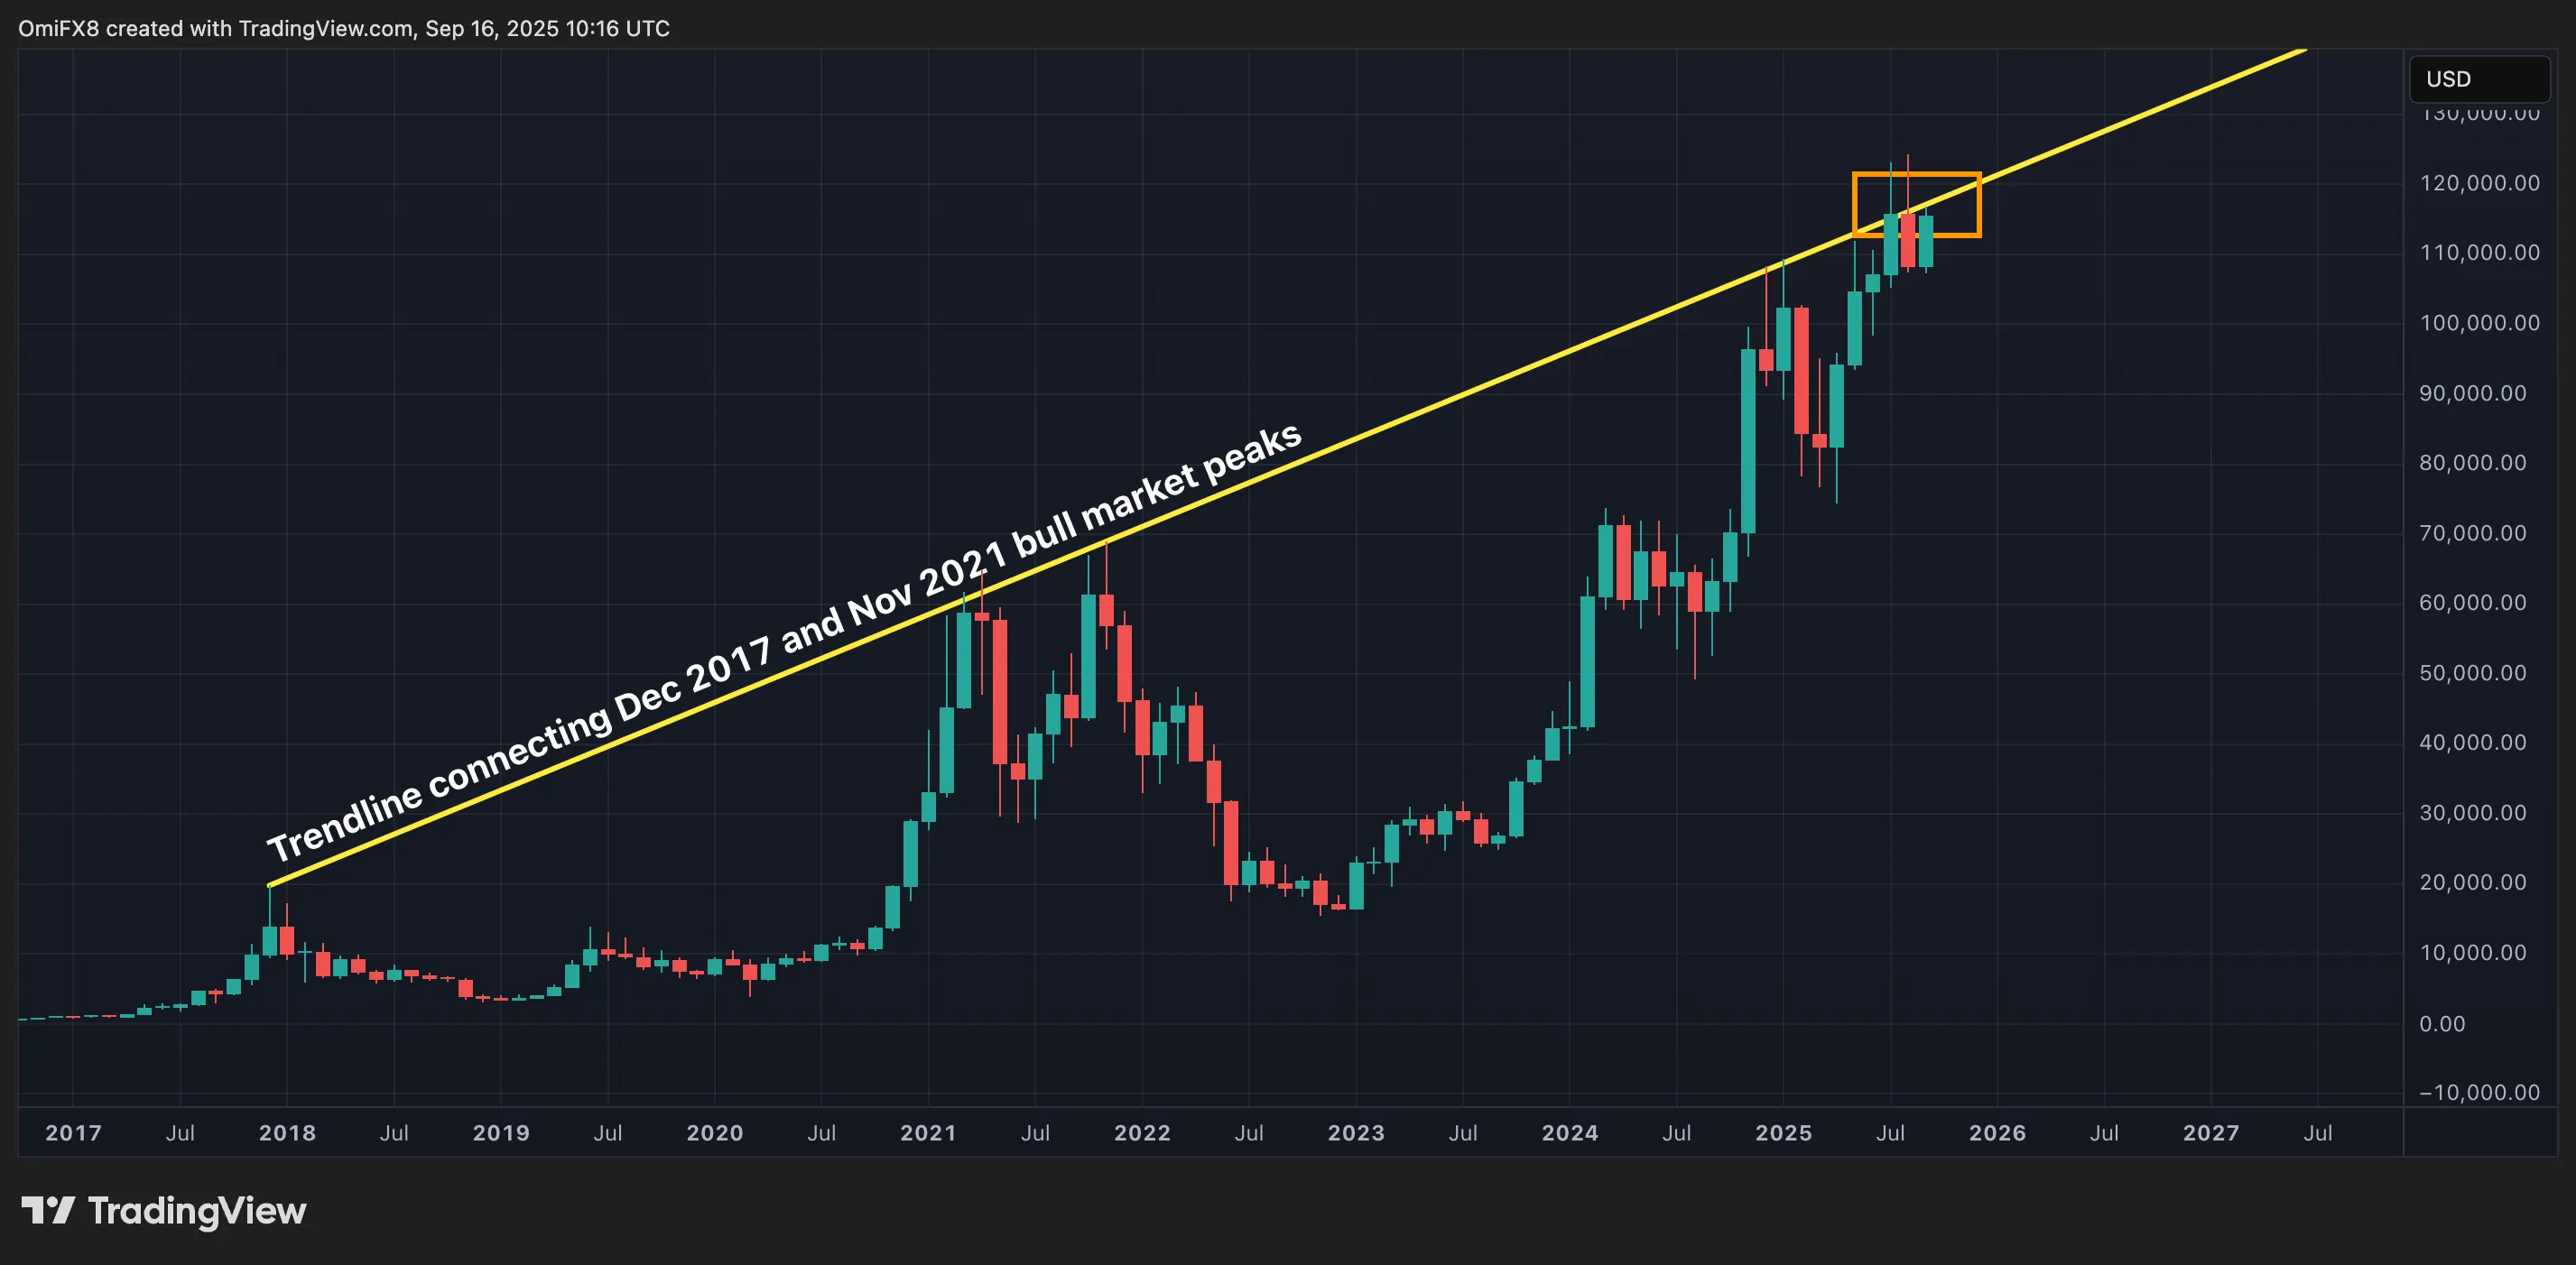
Can the bulls crack it on a third attempt? Possibly. Many analysts expect bitcoin to continue grinding higher into year-end, buoyed by the widely anticipated Fed rate cut. But a third consecutive failure here would strengthen the bears hand, potentially fueling a deeper pullback.
The first warning signs of a breakdown could emerge if daily prices slip below the Ichimoku cloud, currently acting as a zone of indecision. As of writing, bitcoin trades within that cloud, offering little directional clarity. Crosses above or below this cloud often signal shifts in momentum, so traders should watch carefully.
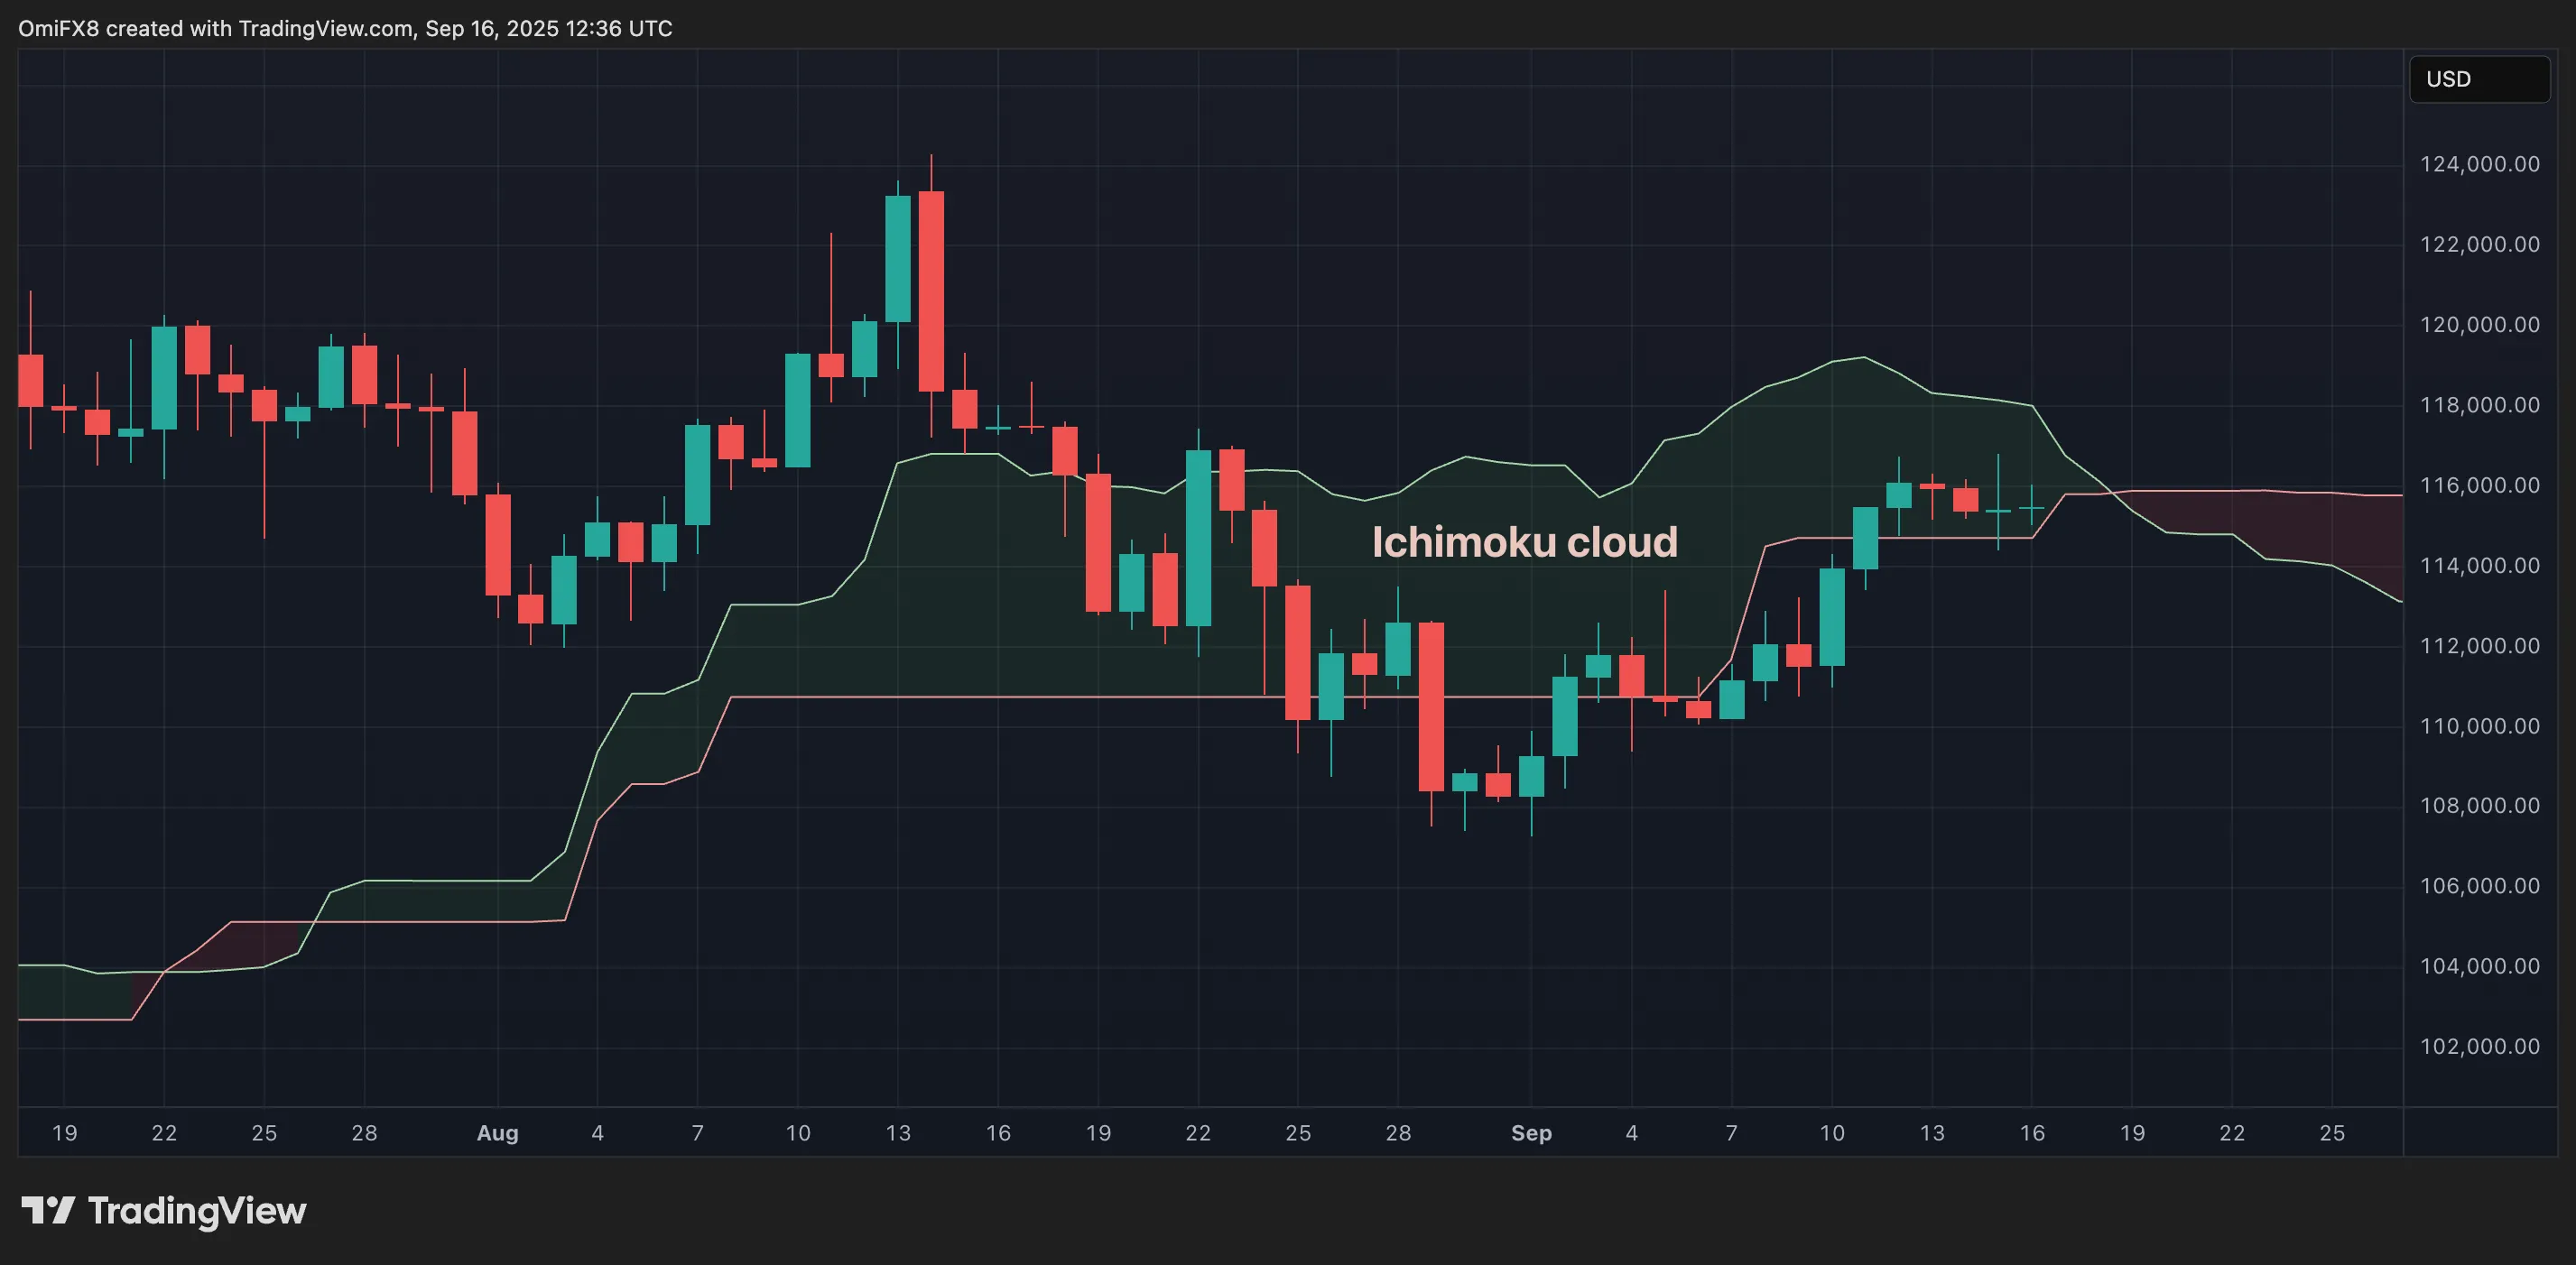
BTC trades within the Ichimoku cloud. (TradingView/CoinDesk)
SOL‘s ’Shooting Star Warning
While enthusiasm around a solana's (SOL) price prospects remains high, the technicals suggest a note of caution. On Sunday, SOL formed a classic “shooting star” candlestick after hitting a multi-month high near $250, only to pull back sharply by the close.
This pattern, a small real body with a long upper shadow after a protracted uptrend, as in SOL's case, signals that buyers pushed prices higher but ultimately lost control to sellers, who drove the price back down near the days low.
The bearish signal was confirmed when prices dipped further to about $230 on Monday, indicating a possible trend reversal.
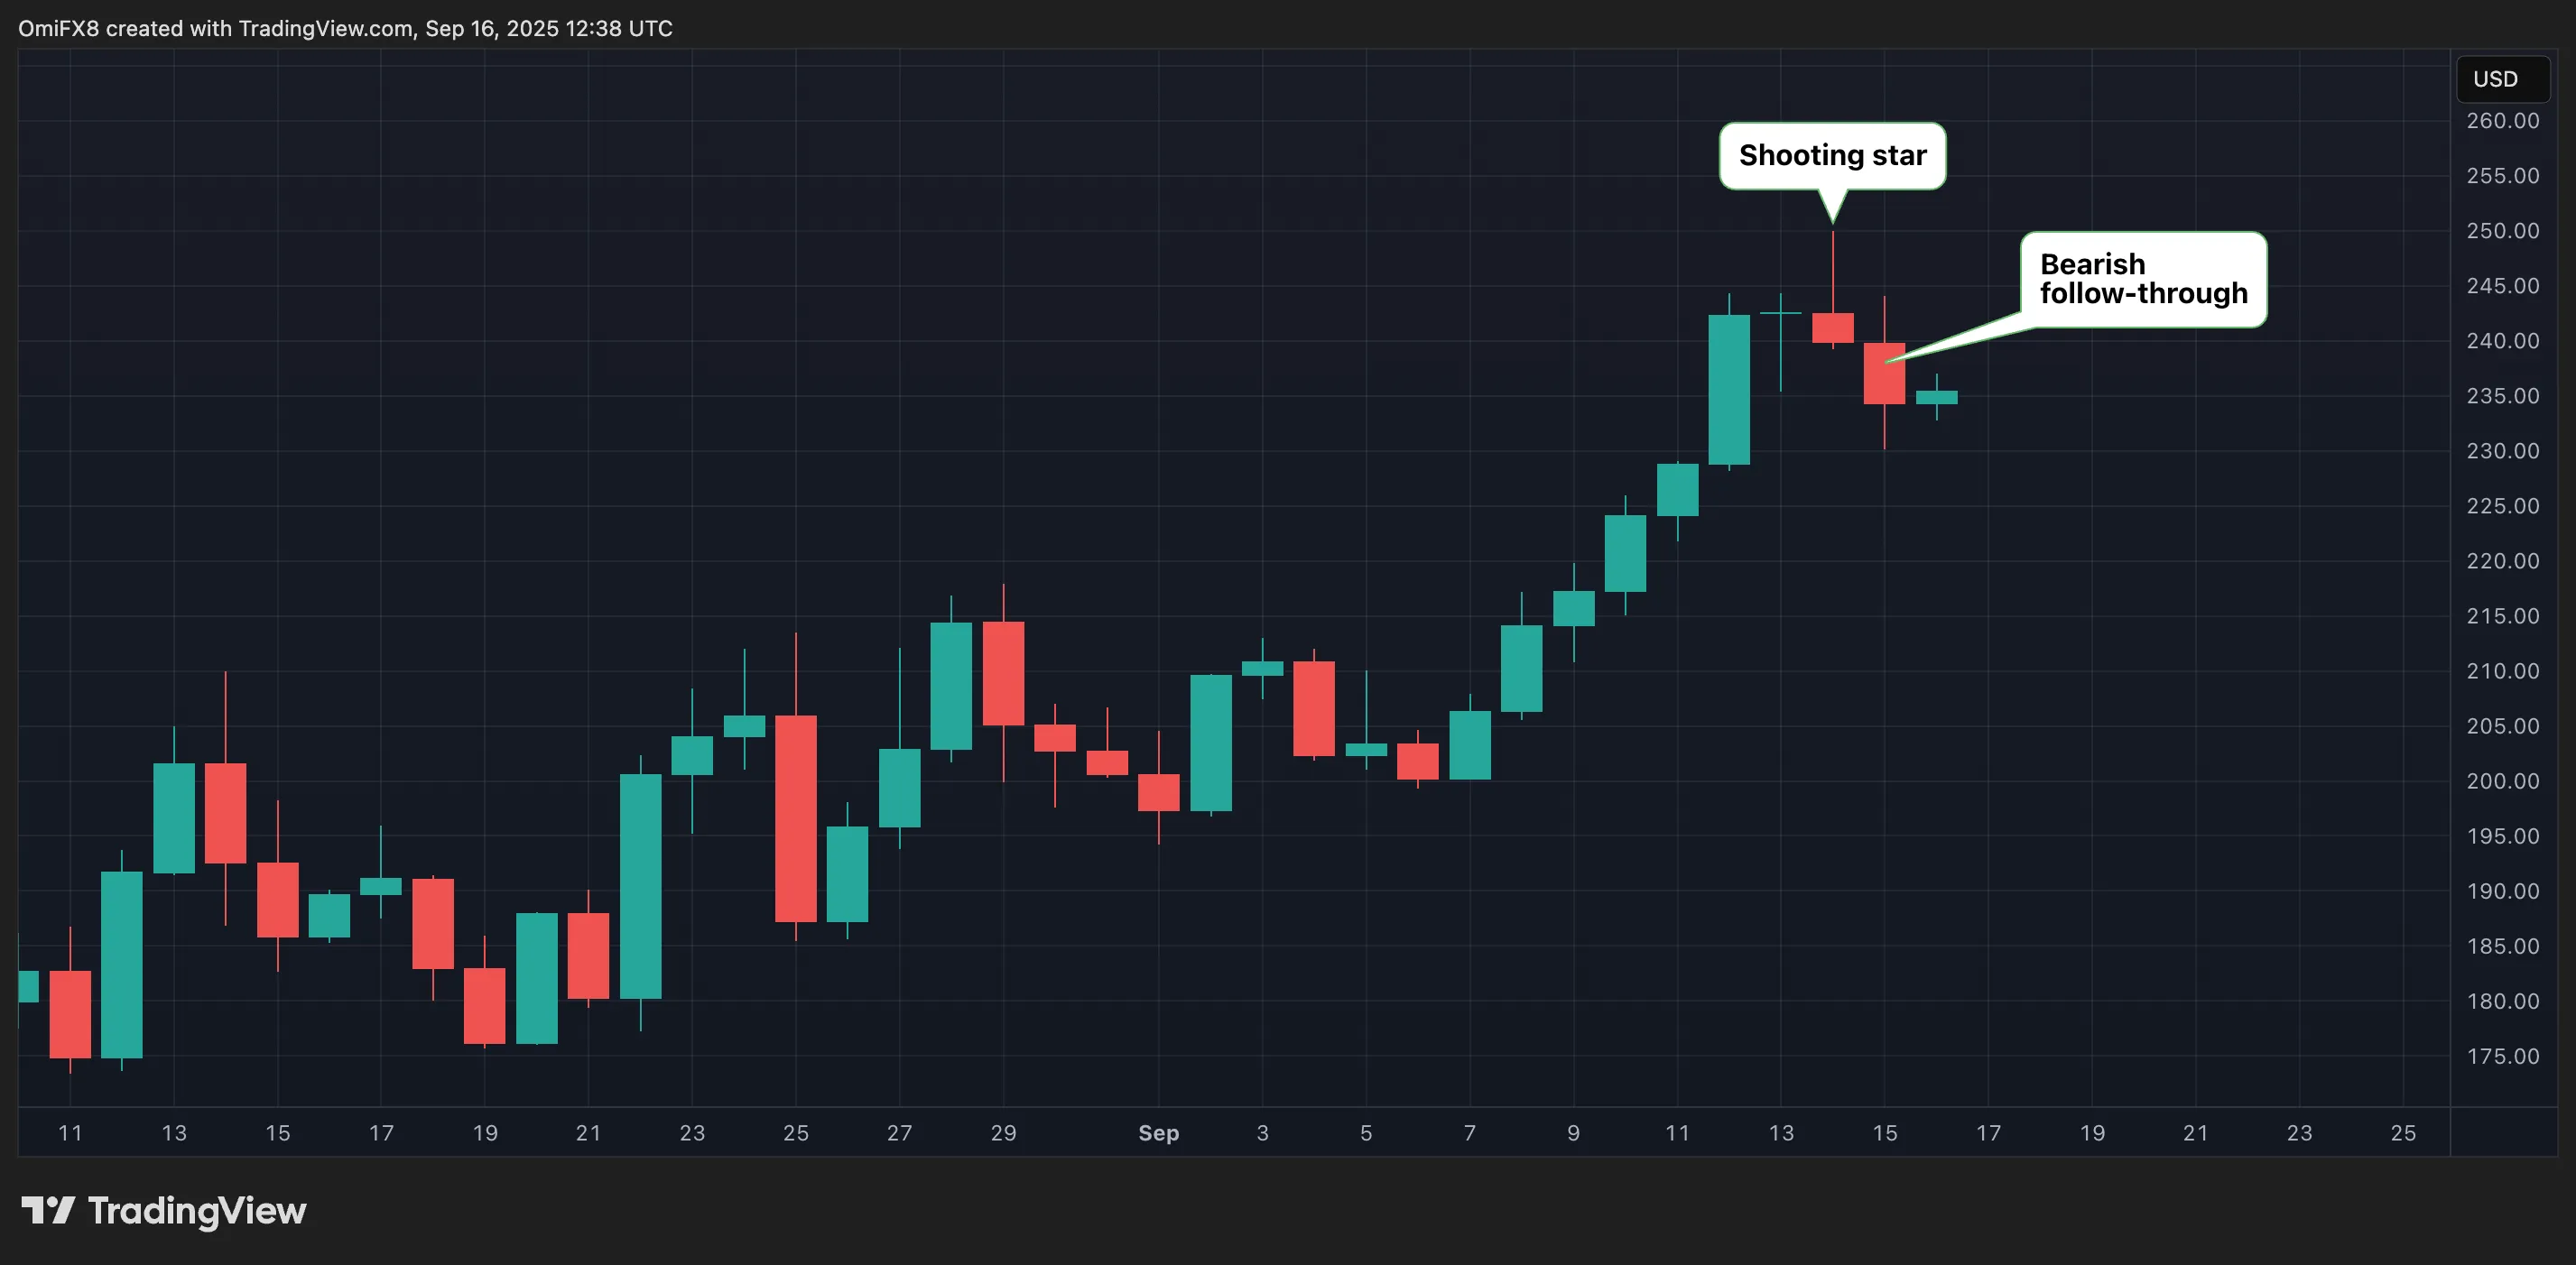
SOL has chalked out a bearish shooting star pattern. (TradingView/CoinDesk)
For bulls to regain control, SOL would need to reclaim and hold above the $250 peak. Otherwise, the path looks toward a deeper decline, especially if the Feds upcoming decision disappoints markets by implying a more hawkish stance over the coming months.
Ether's narrowing price range
Ether (ETH), meanwhile, seems to have lost its earlier momentum, drifting sideways after hitting an all-time high near $5,000 last month. The price action has formed a symmetrical triangle – a technical pattern representing indecision, where neither bulls nor bears are ready to make a decisive move.
These triangles typically resolve with a breakout or breakdown, setting the tone for the next directional move. For now, it‘s best to wait for clear signals as Ether’s price consolidates within this tightening range.
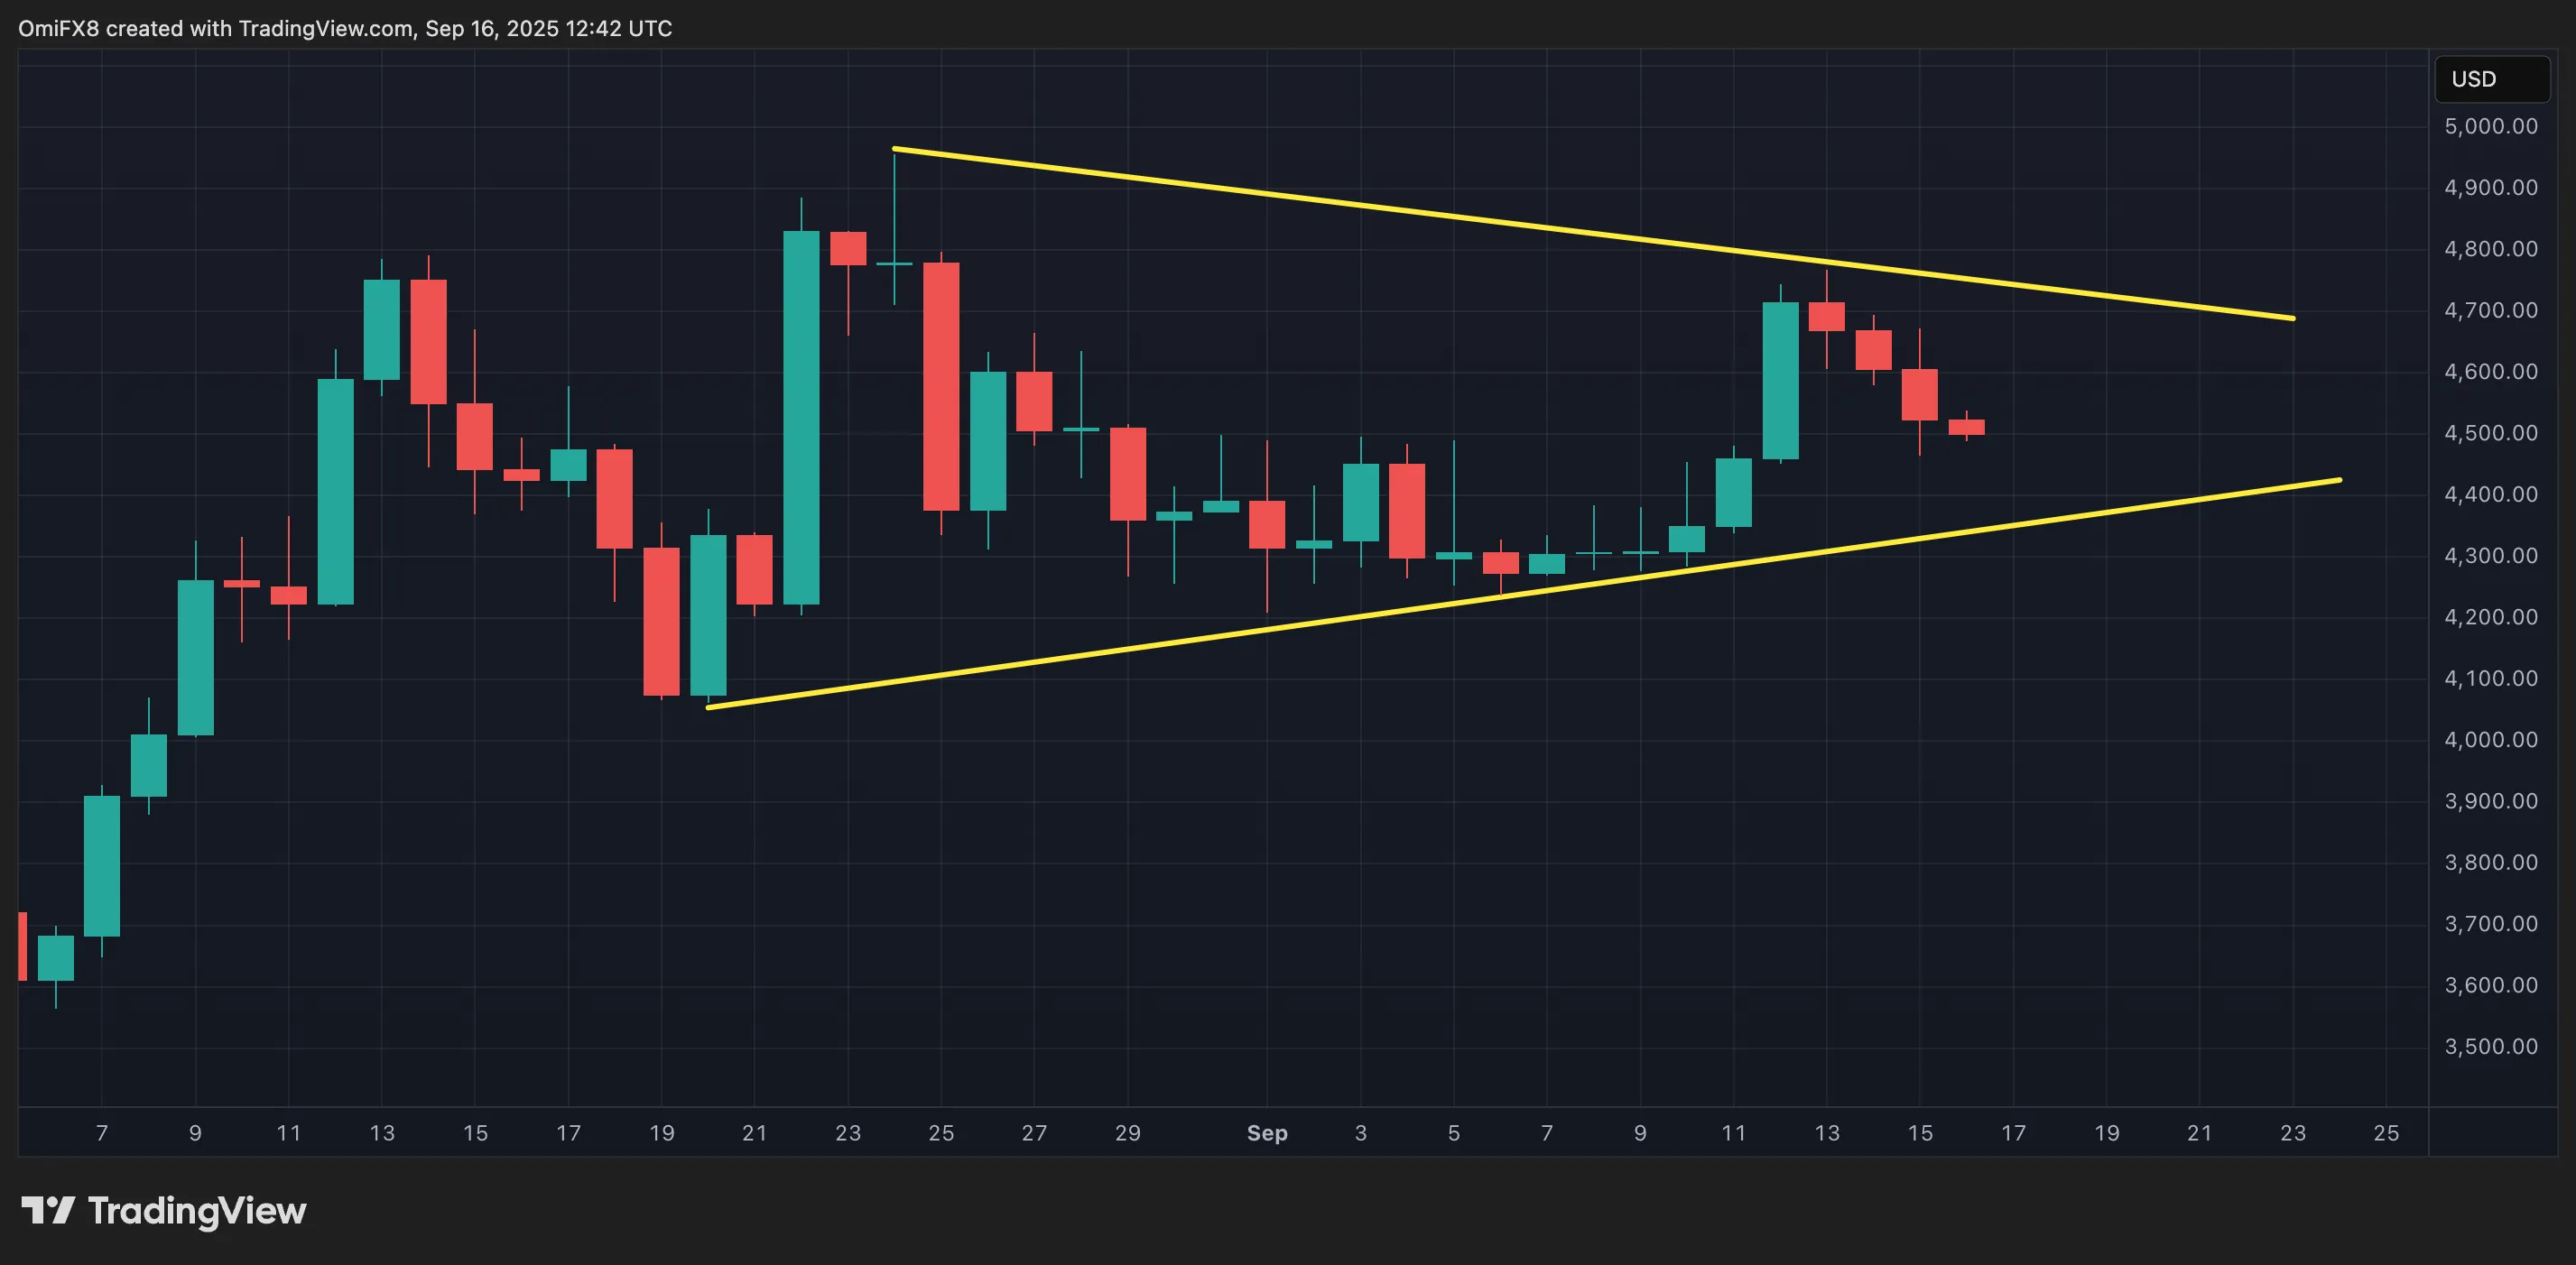
Ether's triangular consolidation. ((TradingView/CoinDesk)