






Dogecoin remains bearish at the time of writing as it just broke below its immediate price support line. Broader market weakness can be attributed to the price fall. Major market movers have displayed choppy price action.
Over the last 24 hours, Dogecoin lost 2% and in the last week, it declined by 8%. The global cryptocurrency market cap was at $1.93 Trillion as there has been a decline of 0.2% in the last 24 hours.
The meme coin has been facing tough resistance at its immediate price ceiling. Buyers have also decided to lay low as a reason the coin continues to fall prey to selling pressure.
Constant fall in buying pressure has pushed the coin to break its immediate support level and eye its next price floor.
Dogecoin Price Analysis: Four Hour Chart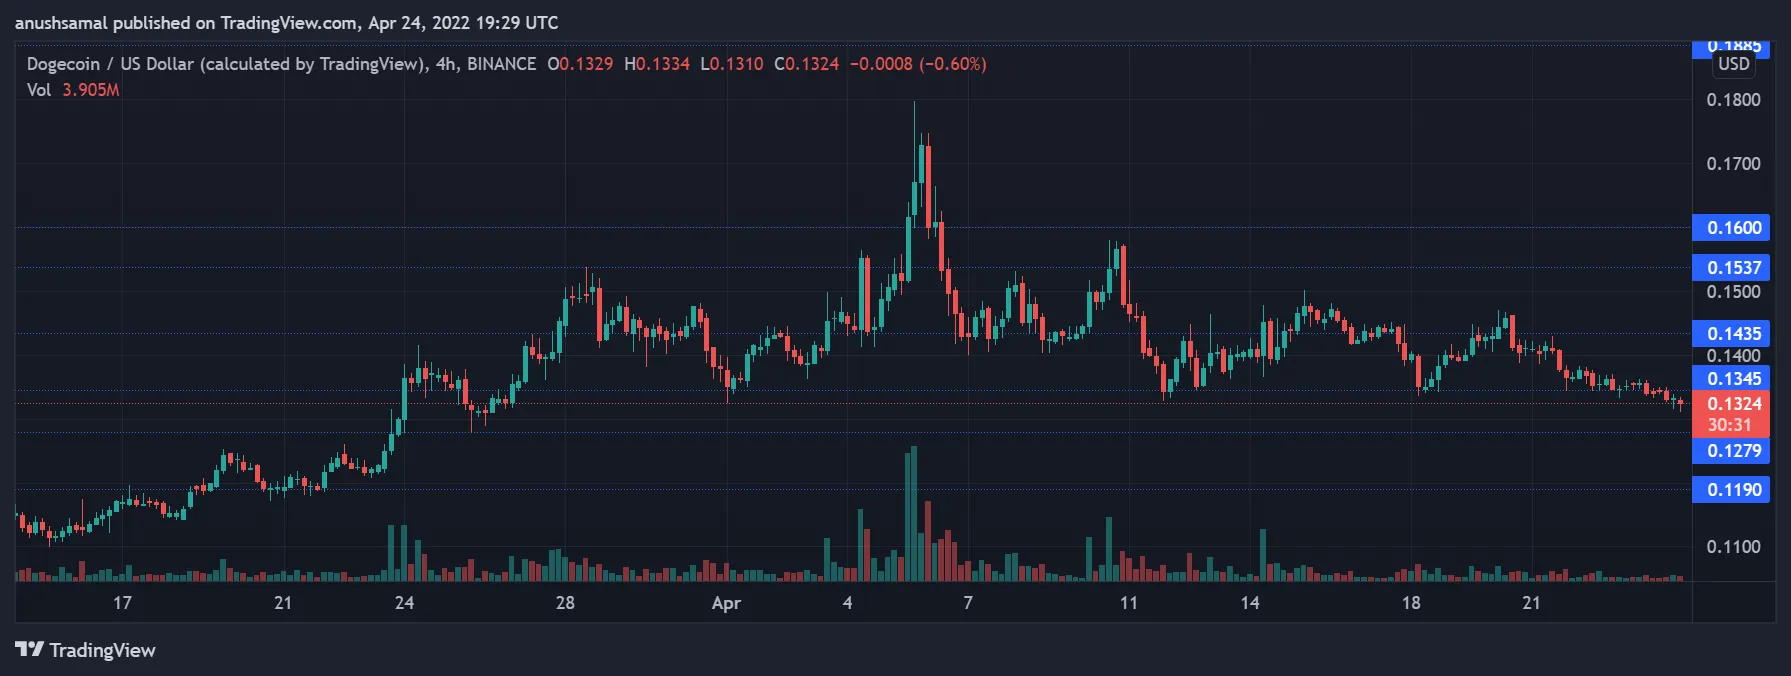
Dogecoin just broke below the price support level of $0.134 on the four-hour chart. Image Source: DOGE/USD on TradingView
Dogecoin was trading for $0.1324 as it breached its support level of $0.1345 at the time of writing. The coin has been bearish and it has been trading in a descending channel that is considered to be negative.
A continued fall in prices could push DOGE to $0.1279 marking a 4% fall. If the coin is unable to stay on the above-mentioned support line, it could trade near the $0.1190 level.
Trading Volume was seen in the red and the bar was smaller than the previous trading sessions, suggesting a sell-off on the charts.
Immediate resistance for the coin was seen at $0.1537 and the coin continued to face rejection at the aforementioned point. Another strong resistance for the meme-coin was at $0.1600.
Technical Analysis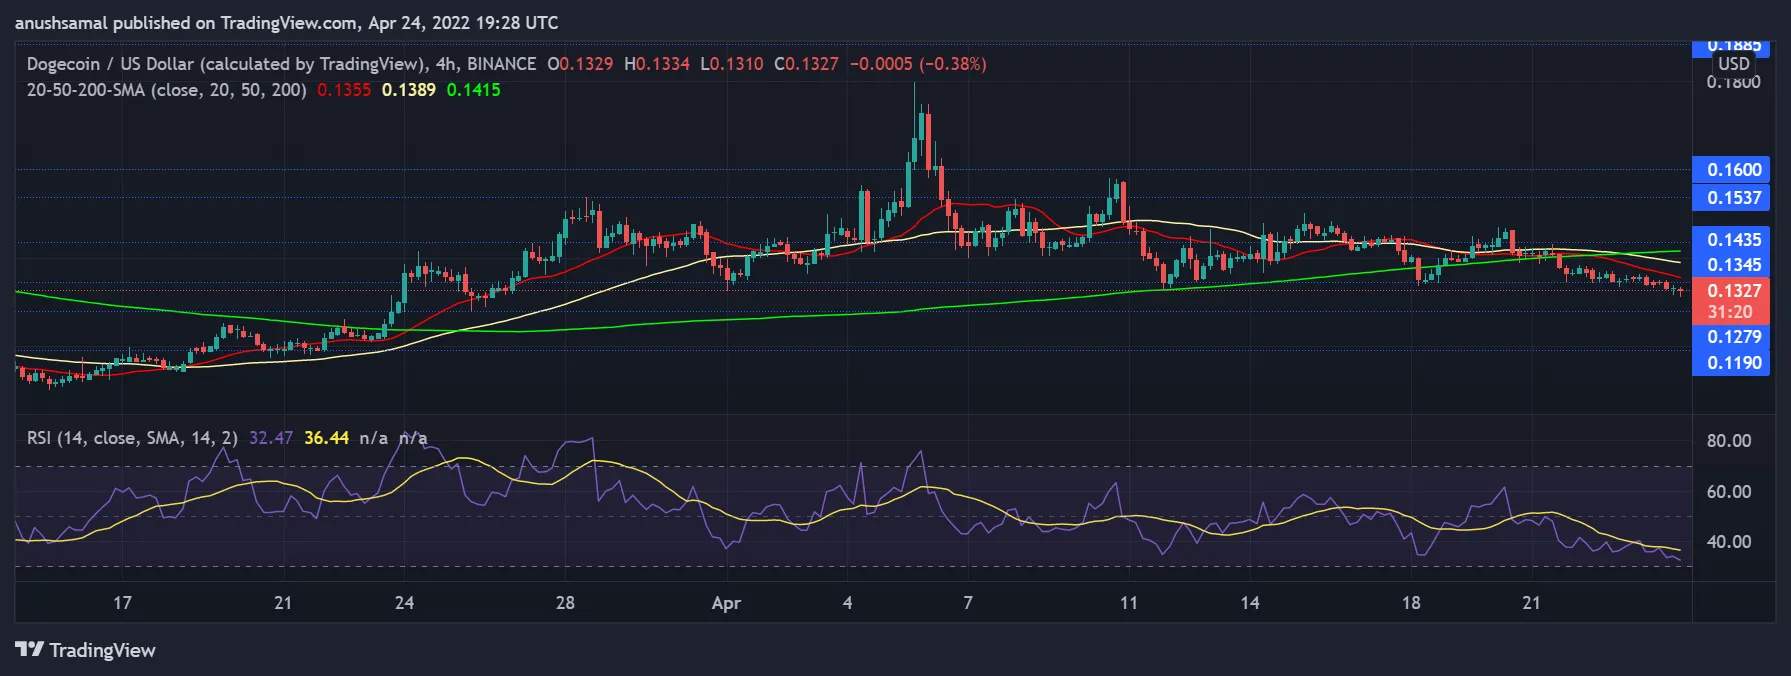
Dogecoin experienced negative buying pressure on the four-hour chart. Image Source: DOGE/USD on TradingView
Dogecoins prices were trading beneath the 20-SMA line, which is in accordance with increased selling pressure. Sellers were driving the price momentum in the market according to the 20-SMA line. A significant push from the buyers could provide a momentary respite to the coin.
The Relative Strength Index was seen below the half-line signifying that buyers have exited the market. The asset was oversold and undervalued at the press time. Further oversold conditions can drag prices down to the next support level.
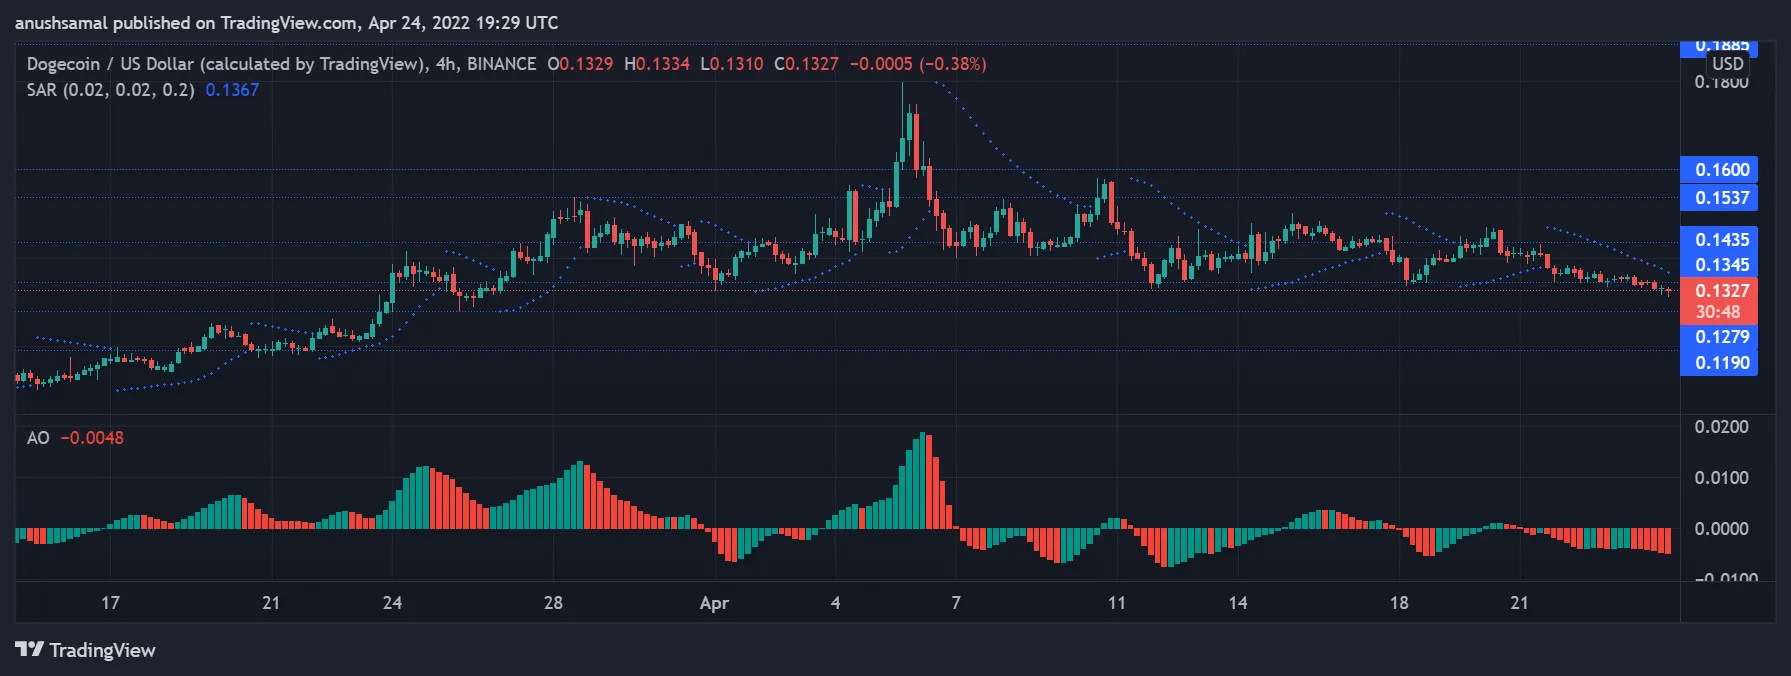
Dogecoins price momentum remains negative on the four-hour chart. Image Source: DOGE/USD on TradingView
Awesome Oscillator determines the price momentum of the coin. Dogecoin was on negative price momentum. AO projected red histograms underneath the half-line, which signifies a negative price momentum.
Parabolic SAR is an indicator that helps to understand trend direction and also the potential price reversals. Parabolic SARs dotted lines were seen above the price candlesticks, which meant that the price was moving south at the time of writing. This meant that the price trend was negative on the four-hour chart.