The bear are still holding firm on to the markets, as seen from the continous decrease in the global market cap. The total cap stood at $2.11T as of press time, representing a 2% decrease over the last 24 hours, while the trading volume also dropped by 17.64% over the same period to stand at $95.06B as of press time.
Bitcoin Price Review
Bitcoin, $BTC, has failed to post gains in todays session, as seen from its price movements. Looking at an in-depth analysis, we see that the price is moving below the 20-period SMA and within the lower half of the Bollinger Bands, indicating a bearish bias. Bollinger Bands are widening, suggesting increased volatility.
On the other hand, we see that the ADX indicator shows a value of around 50.93, which indicates that the current trend (bearish) is strong. Bitcoin traded at $60.921 as of press time, representing a 0.6% decrease over the last 24 hours.
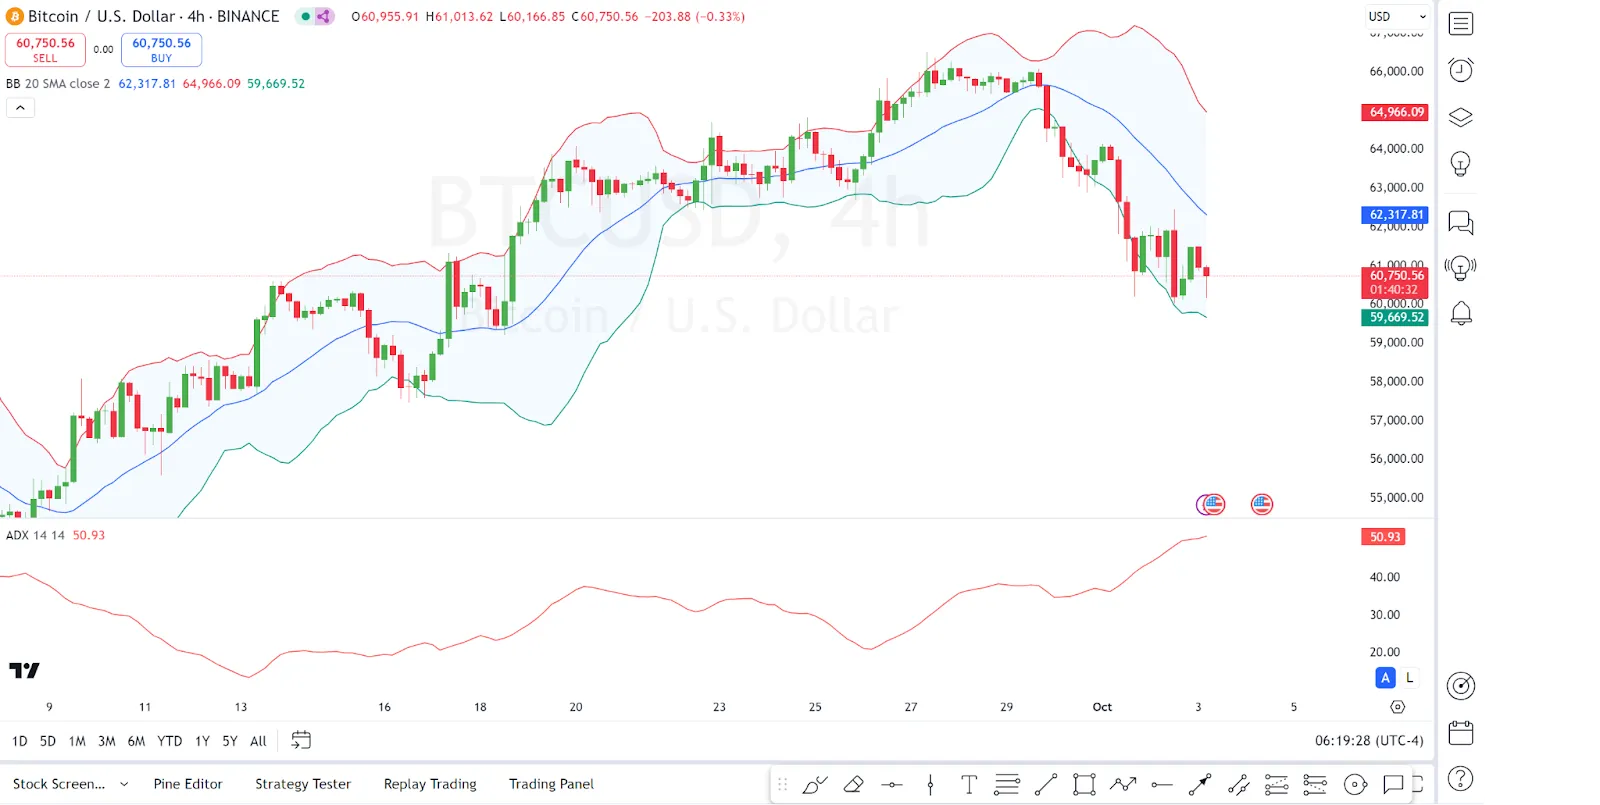
4-hour BTC|USD Chart | Source: TradingView
Ethereum Price Review
Ethereum, $ETH, is also not among the gainers in todays session as seen from its price movements, looking at an in-depth analysis, we see that the price is trading below all three lines of the Alligator Indicator (Jaw, Teeth, and Lips), indicating a bearish trend. The lines are also diverging, signaling a strong downtrend.
On the other hand, we see that the MFI is at 15.94, indicating oversold conditions. This may suggest a possible bounce or consolidation in the near future. Ethereum traded at $2,360 as of press time, representing a 4.12% decrease over the last 24 hours.
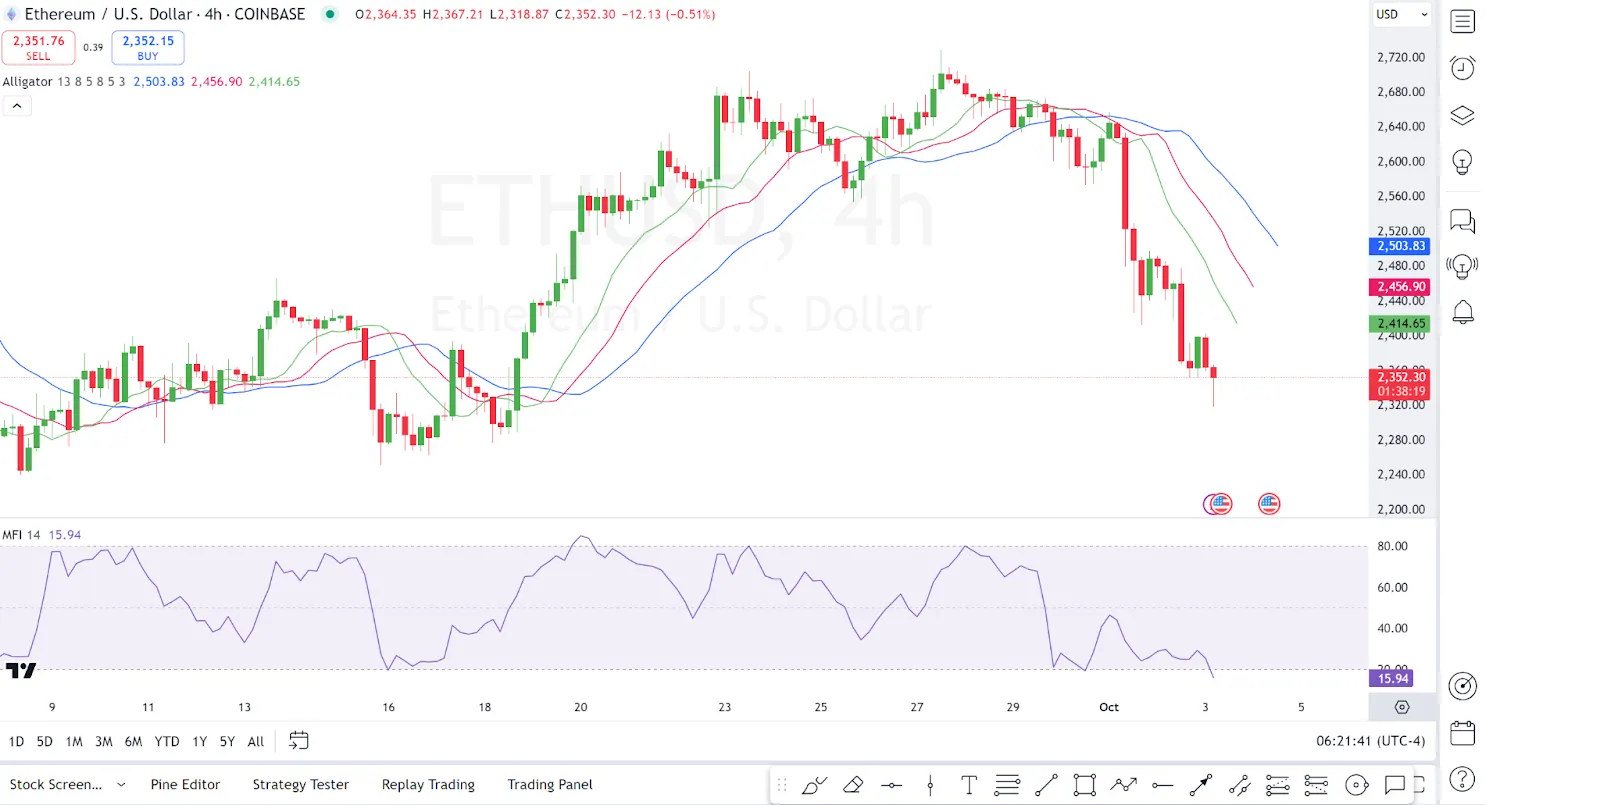
4-hour ETH/USD Chart | Source: TradingView
Ripple Price Review
Ripple, $XRP, is also not among the gainers in todays session as seen from its price movements, looking at an in-depth analysis, we see that XRP is trading well below both the 50-period and 100-period EMAs, which are providing resistance levels around 0.5941 and 0.5910. This indicates that XRP is in a strong downtrend.
On the other hand we see that the Awesome Oscillator is deeply negative, with red bars showing further downside momentum. Ripple traded at $2,360 as of press time, representing a 4.12% decrease over the last 24 hours.
4-hour XRP/USD Chart | Source: TradingView
Straknet Price Review
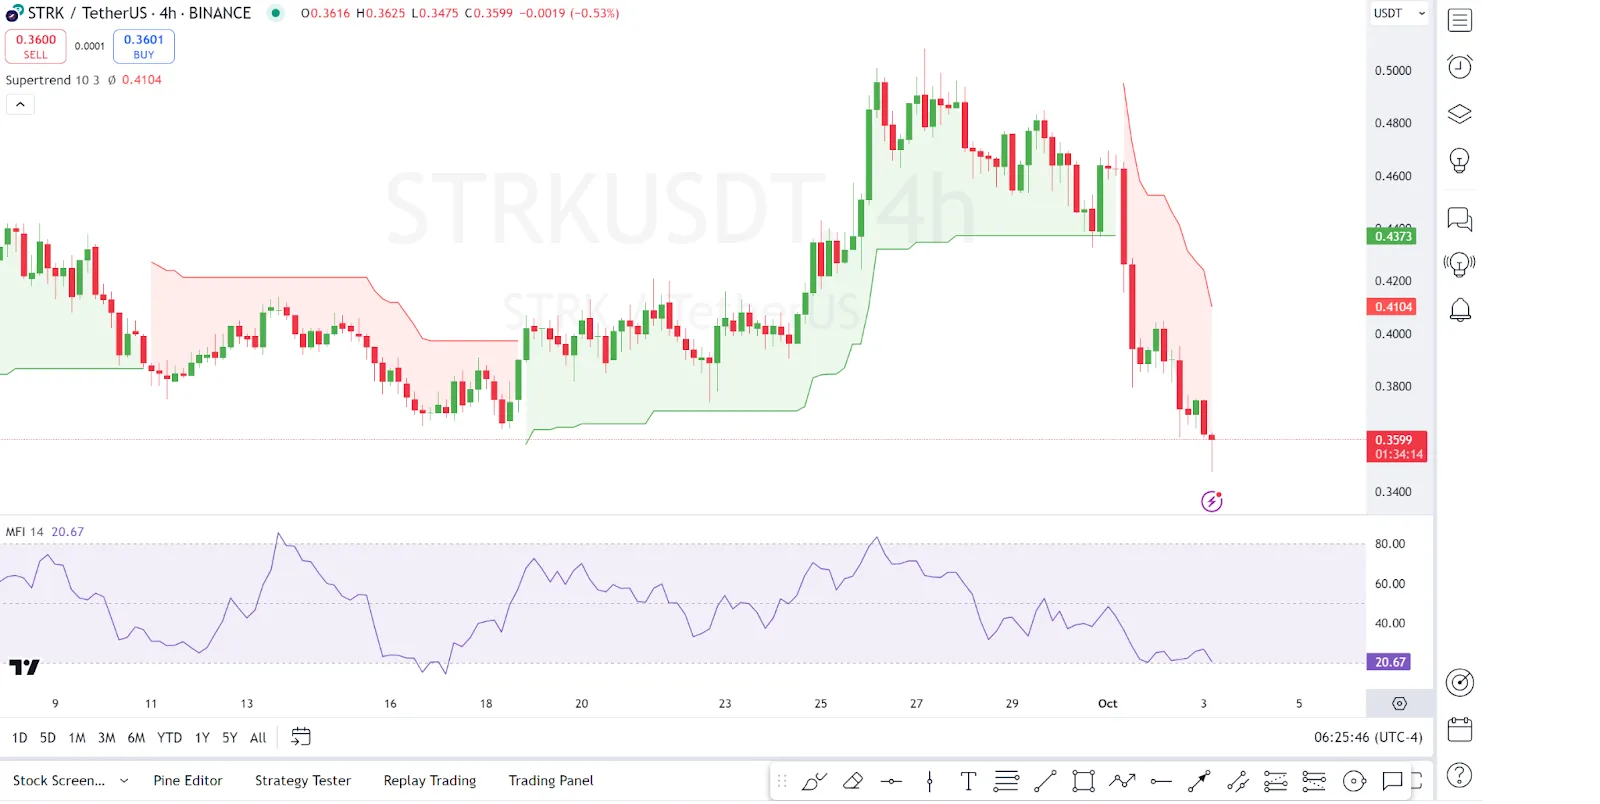
Starknet, $STRK, is among the top losers as well as seen from its price movements. Looking at an in-depth analysis, we see that STRK is below the Supertrend level (0.4104), which is indicating a sell signal. The Supertrend shows that STRK is in a well-established downtrend.
On the other hand, we see that the MFI is at 20.67, which indicates the market is nearing oversold conditions. However, it has not yet hit extreme oversold levels, so further downside is possible. Starknet traded at $0.3657 as of press time, representing a 6.3% decrease over the last 24 hours.