Crypto-markets noted a surge in inflows as Bitcoin climbed above $52k for the first time in nearly 4 months. Amidst gains witnessed across some alts, Solana stood out from the pack. Its daily gains of 27% were the highest among the top 50 coins by market cap.
In fact, the altcoin has turned somewhat into a safe haven for investors looking to make quick gains even when the broader market has looked bleak. To put this in perspective, SOL‘s monthly gains stood at 390%, compared to Bitcoin’s 20%, at press time.
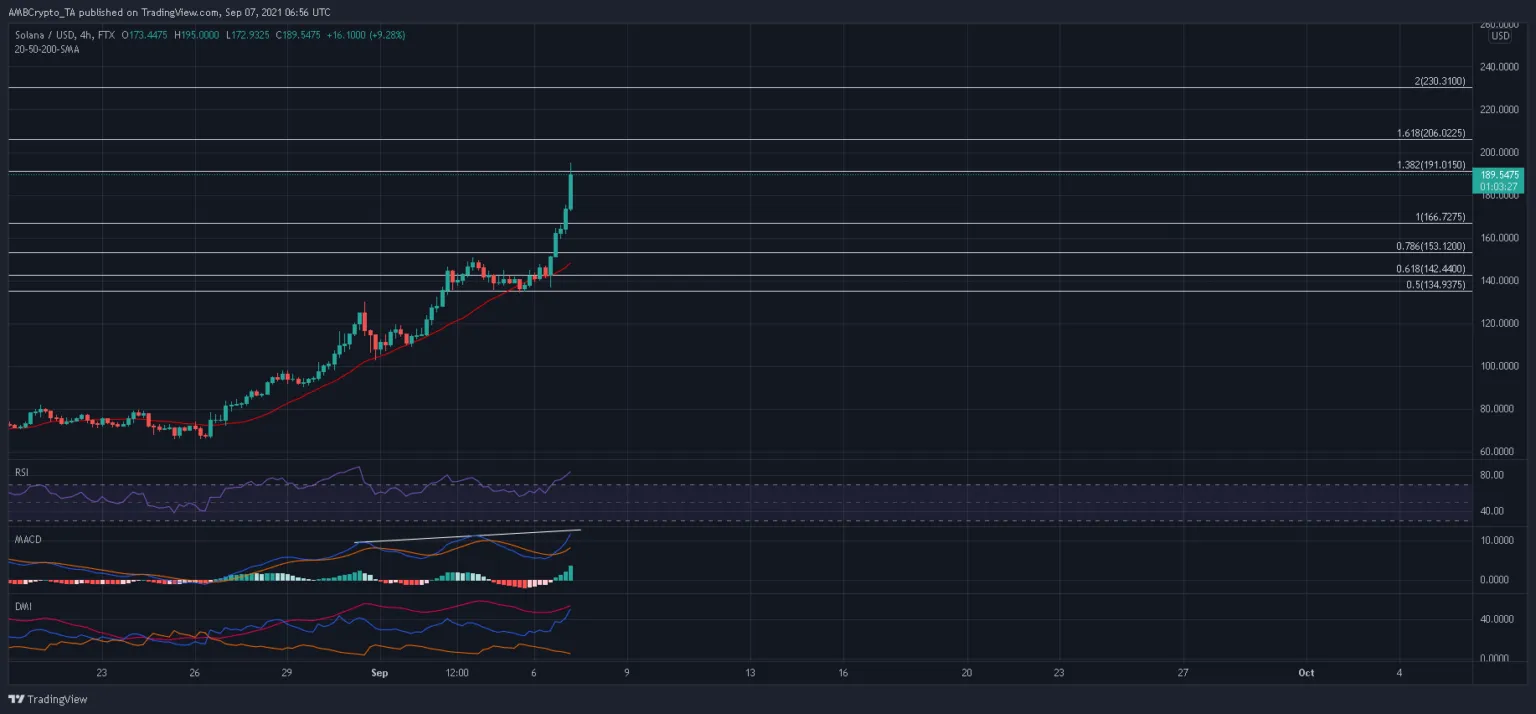
On the charts, SOL continues to march forward after overtaking important Fibonacci Extensions levels. However, high volatility could easily turn into a bane when the next correction hits the market.
SOLs retracement from $130 to $101 in late-August was plotted on the Fibonacci tool to identify some important extension zones. SOL eyed the immediate 138.2% and 161.8% Extension levels over the near term, while a more mid-term target lay at the 200% Extension.
However, it is important to understand that the aforementioned levels function as sell-off points for investors looking to book their profits. Since SOL saw a meteoric rise in value in such a short duration, its market is quite vulnerable to a correction.
Ideally, the psychological $200 mark and the crucial 138.2% Fib level could induce some selling in the market. SOL would then need to hold above its 4-hour 20 SMA (red) to prevent short-selling.
ReasoningThe MACD traded at exuberant levels and concurred with SOLs price action. Meanwhile, the Directional Movement Index identified strong upwards momentum in the market as the +DI traded above the -DI. However, chances of a retracement run high whenever the RSI trades in overbought territory.
Such was the case with SOL, which peaked in the upper zone thrice over the past week. Nevertheless, the RSIs highest peak clocked in at 90.6 during mid-August. This meant that the index had slightly more room to grow before reversing.
ConclusionThe RSIs overbought nature called for a healthy correction moving forward. The $200-mark and the 138.2% Fibonacci Extension levels could serve as potential take-profits and trigger a downwards push.
In such a case, traders should be on the lookout for a close below the 100% Extension level and 4-hour 20-SMA as this would invite short-sellers to the market.