




The Dogecoin price is still compressed into a narrowing range just below $0.1, but analyst Lars has issued an update to a technical framework he has been tracking for weeks, one that now points to a significant move coming for the meme cryptocurrency. The outcome, however, hinges on one crucial confirmation that has yet to arrive.
Dogecoin TCT Model Begins To Play Out
Bitcoin inflows are still steering the broader market, but Dogecoin has yet to fully follow that inflow momentum. It briefly pushed above $0.10 in the last 24 hours but has since slipped back below, leaving this level as the key pivot that will determine whether the price remains range-bound or transitions into a more decisive move.
That is the basis of a new chart update from crypto analyst Lars on X, where he said he has adjusted the starting point of the current range and is now waiting for what he calls a TCT model 1 distribution confirmation.
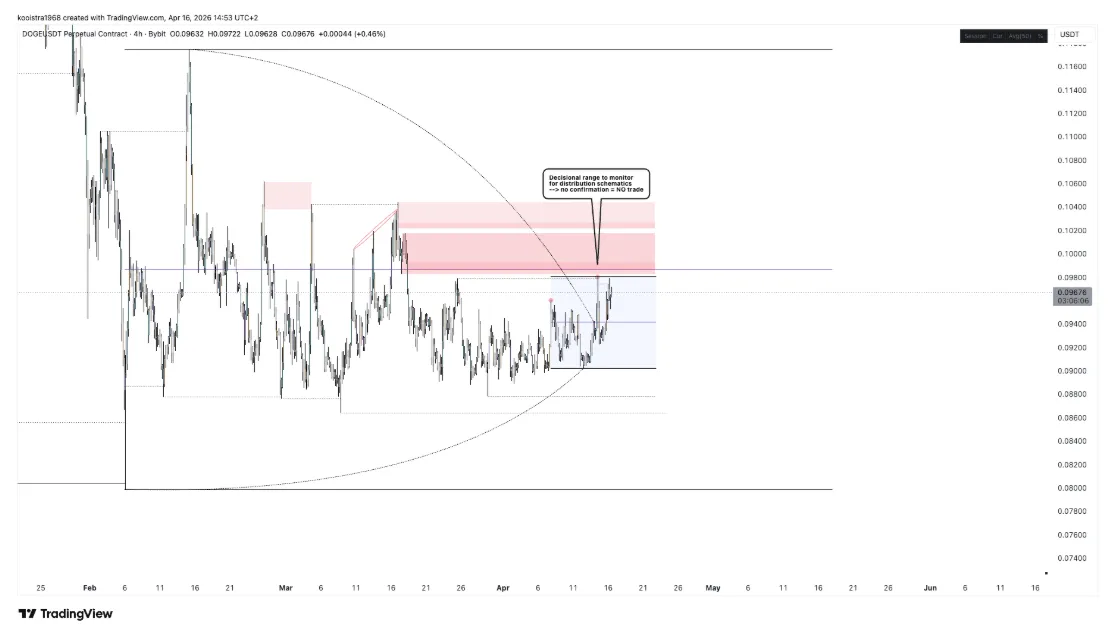
Lars update is centered on a revised read of where the current trading range should begin, which changes how the compression structure is interpreted. In the charts he shared, Dogecoin is shown moving upward into a pink resistance band that stretches from $0.098 into the low-$0.10 region.
That band sits above a series of rising local lows on the one-hour candlestick chart, and the projected path suggests one more push higher into a third tap before rejection. The 4-hour chart carries the same idea on a broader timeframe, where Lars labels the region as a decisional range to monitor for distribution schematics, adding that no confirmation means no trade.
The $0.10 Resistance And What Lies Beneath It
The $0.098 to $0.100 band has functioned as stubborn resistance for Dogecoin since late March. Dogecoin has been forming lower highs while holding a stable base, indicating that while sellers remain active near resistance, they are no longer able to push the price significantly lower. The price action in the past three days, however, led to a higher high compared to April 6, which saw the Dogecoin price tap $0.1 as predicted.
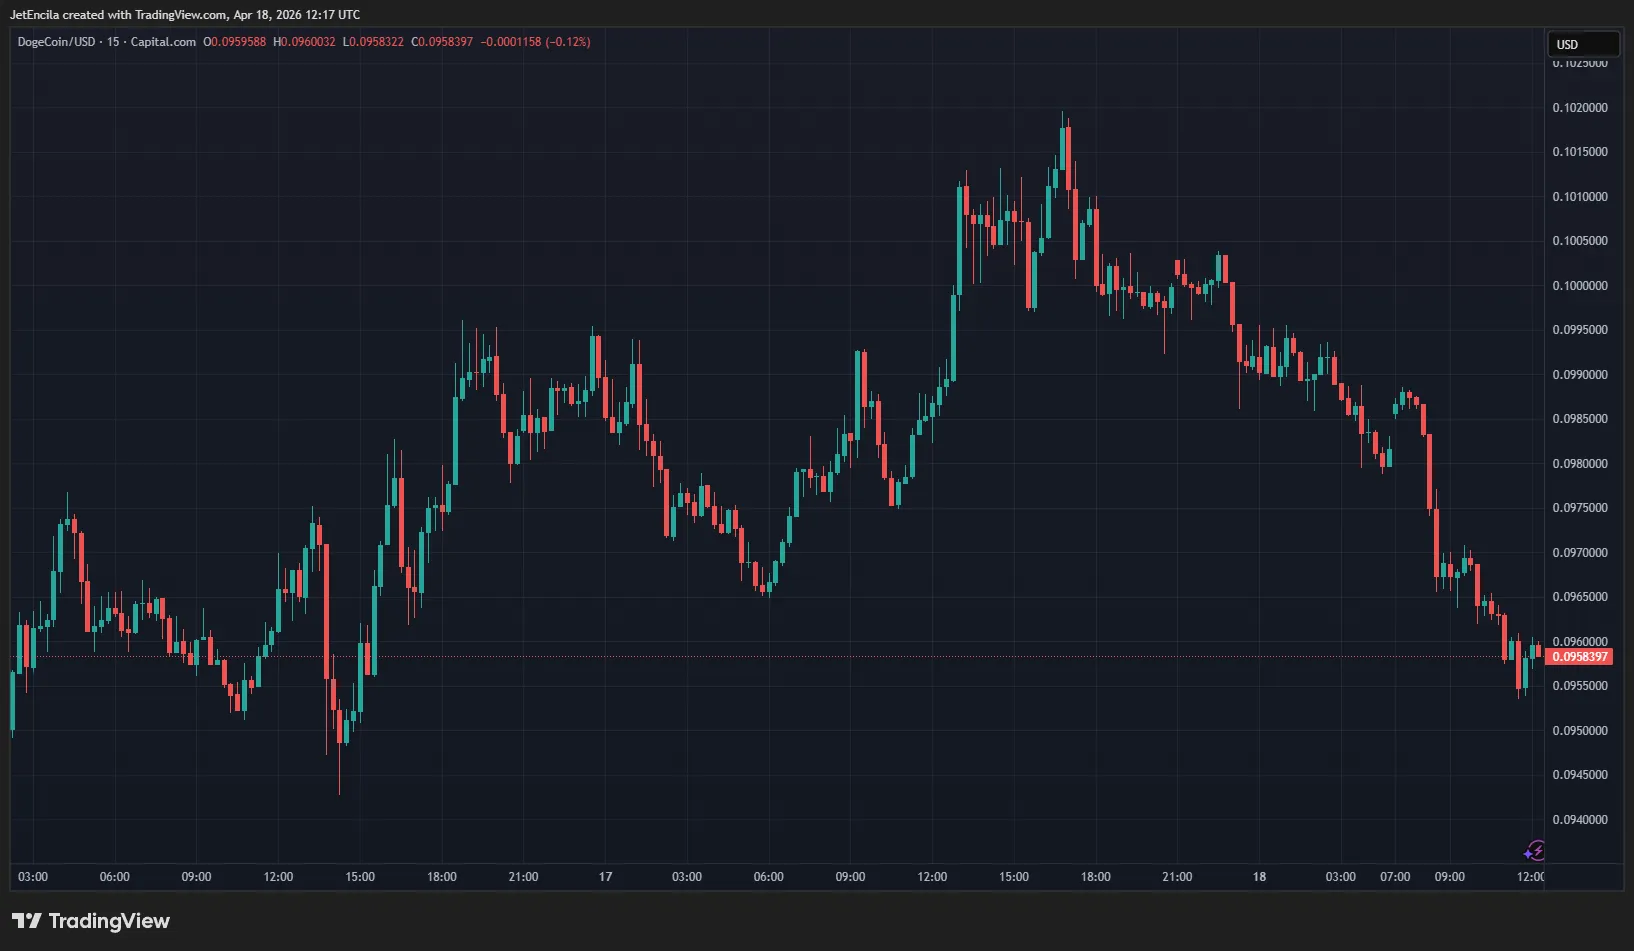
DOGEUSD now trading at $0.095. Chart: TradingView
In another analysis, the analyst said he attempted to short Dogecoin during an extended TCT distribution, following a bearish break of structure at the New York open. The move initially looked like confirmation of further downside, but he noted there were two possible explanations behind the price action.
One scenario was that the breakdown was genuine, with market makers stepping in to push the price lower right at the session open. The other pointed to a manipulation sell-off, possibly linked to Bitcoin accumulation.
The overall outlook for Dogecoin is still mixed when it comes to technical indicators, with 16 indicators currently signaling bearish conditions against 14 bullish signals at the time of writing, while the RSI sits at a neutral 61.45.