Bitcoin and Ethereum experienced another sharp flash crash early this morning, with BTC plunging to around $73,500 and ETH dropping to approximately $2,060.
This latest sell-off can be seen as an extension of last Thursday's market crash, or perhaps a fresh release of accumulated market anxiety. With Monday bringing another wave of negative catalysts, some major players appear to have exited their positions first, triggering a cascading sell-off among leveraged bulls.
Friday's US nonfarm payrolls came in at 165,000, while the unemployment rate stood at 4.1%. These were significant bearish signals. However, the market barely reacted, arguably because much of the panic had already been priced in during Thursday's crash.
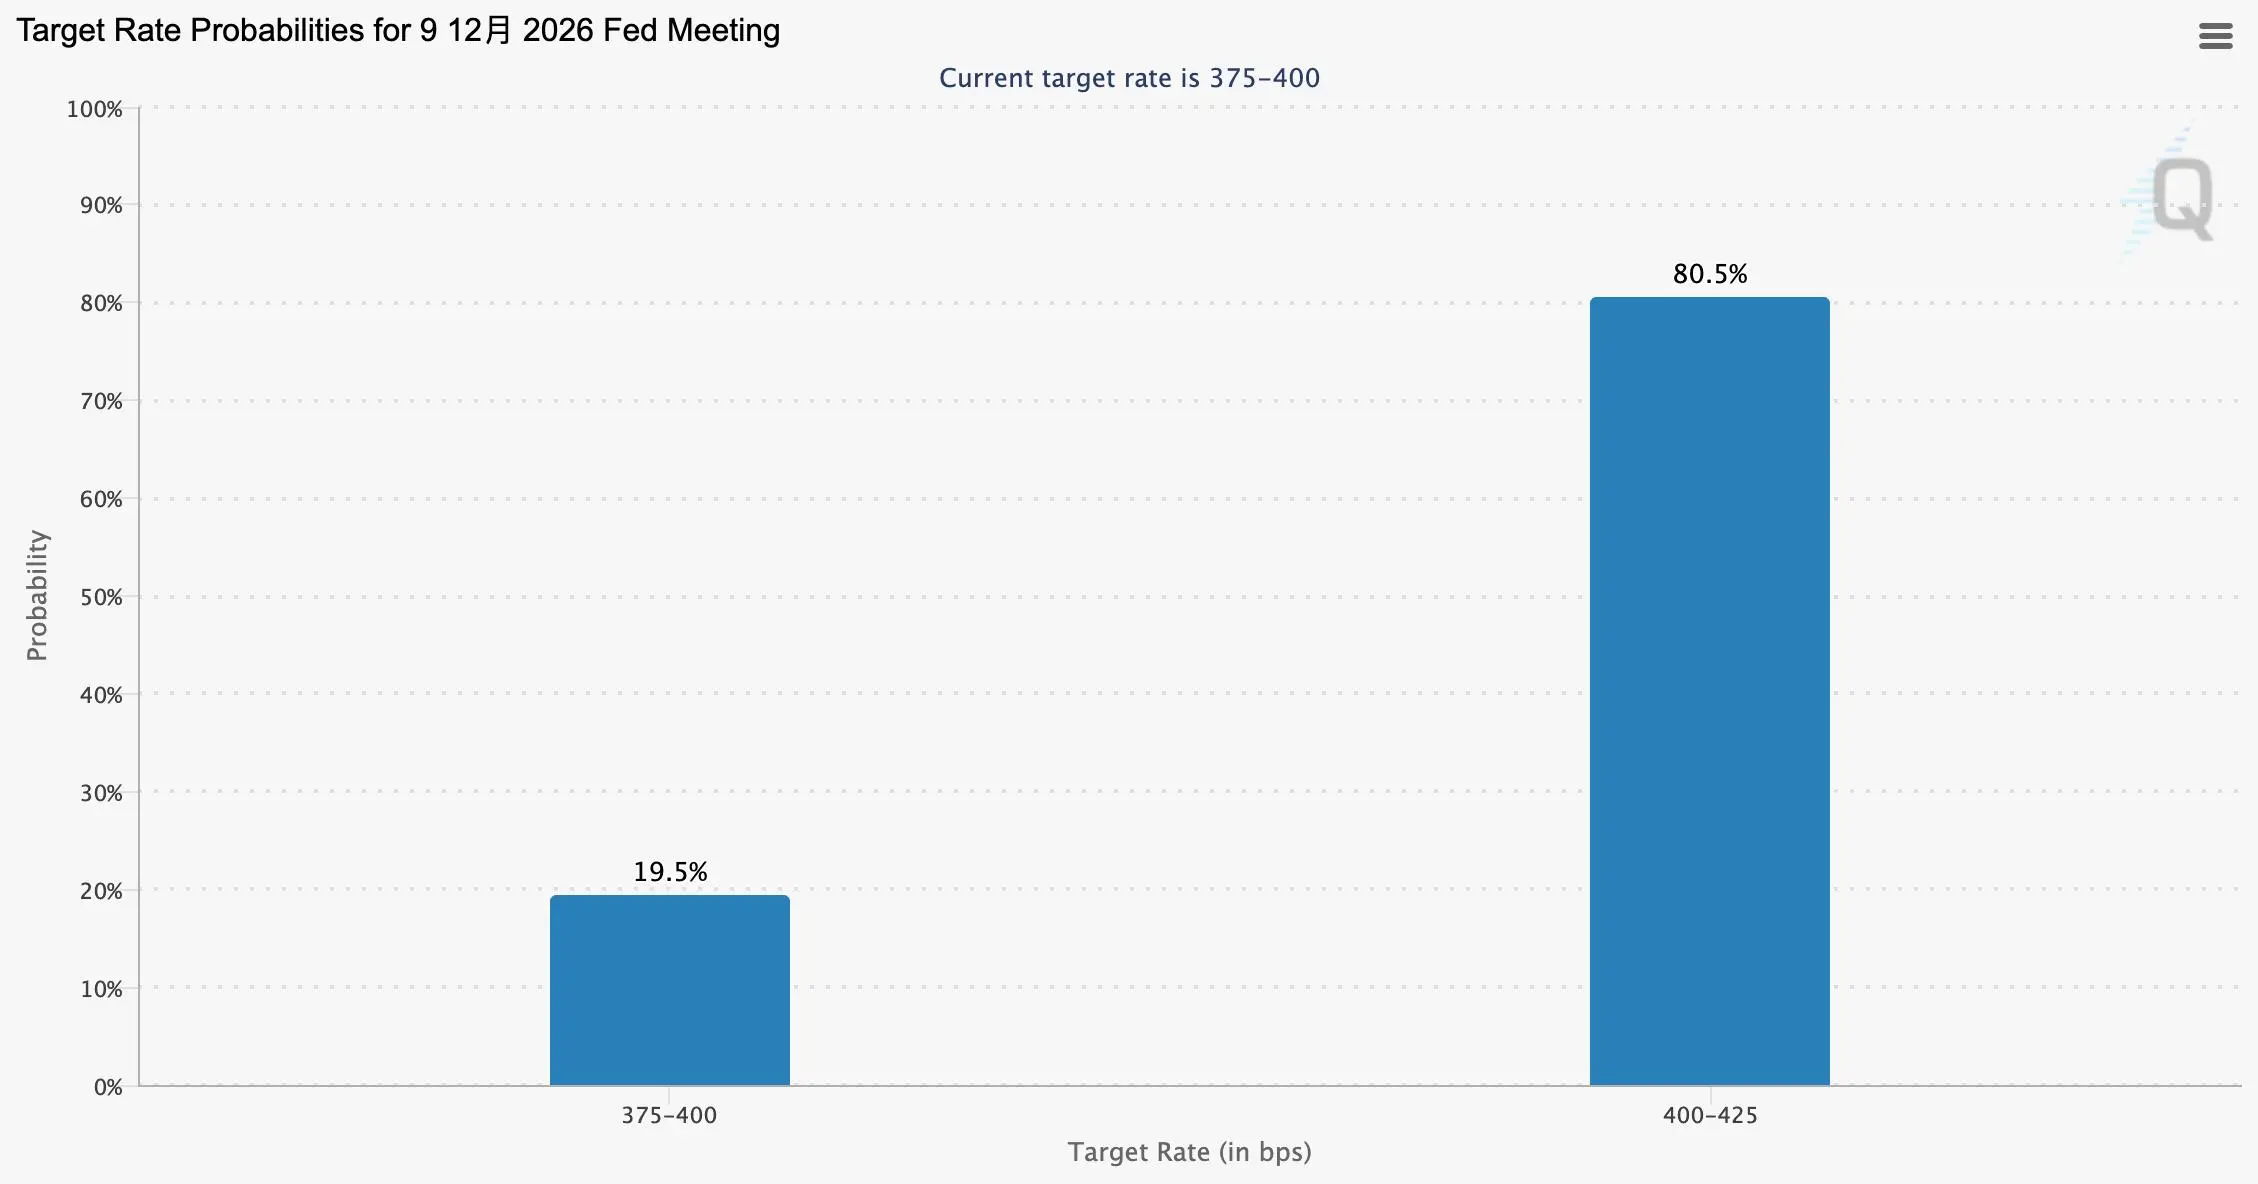
Uncertainty following the Democrats' victory in the US midterm elections has yet to dissipate. Meanwhile, the Federal Reserve's final policy meeting of the year is just 30 days away, and CME FedWatch currently puts the probability of a rate hike above 80%.
Overall, bearish macroeconomic factors continue to accumulate, making another significant sell-off increasingly likely.
So, could Bitcoin soon trade in the $60,000 range? And how should investors position themselves?
1. Macro and Market Structure: The US Midterm Elections Are the Main Source of Short-Term Pressure
Following the Democrats' sweep of both chambers of Congress, markets rapidly began repricing the so-called “Trump Trade.” The previously anticipated path toward crypto-friendly legislation has become increasingly uncertain, triggering a broad unwinding of the policy premium that had supported the industry.
After the election results became clear, BTC briefly fell below $76,000, while ETH dropped below $2,250, wiping out all post-election gains.
More importantly, Democratic control of Congress could bring tighter scrutiny of AI data center construction. The Nasdaq 100 plunged 6.36% in a single session, while the Philadelphia Semiconductor Index slumped 12.25%. Risk assets worldwide experienced simultaneous deleveraging.
Under these conditions, the crypto market is unlikely to rally independently.
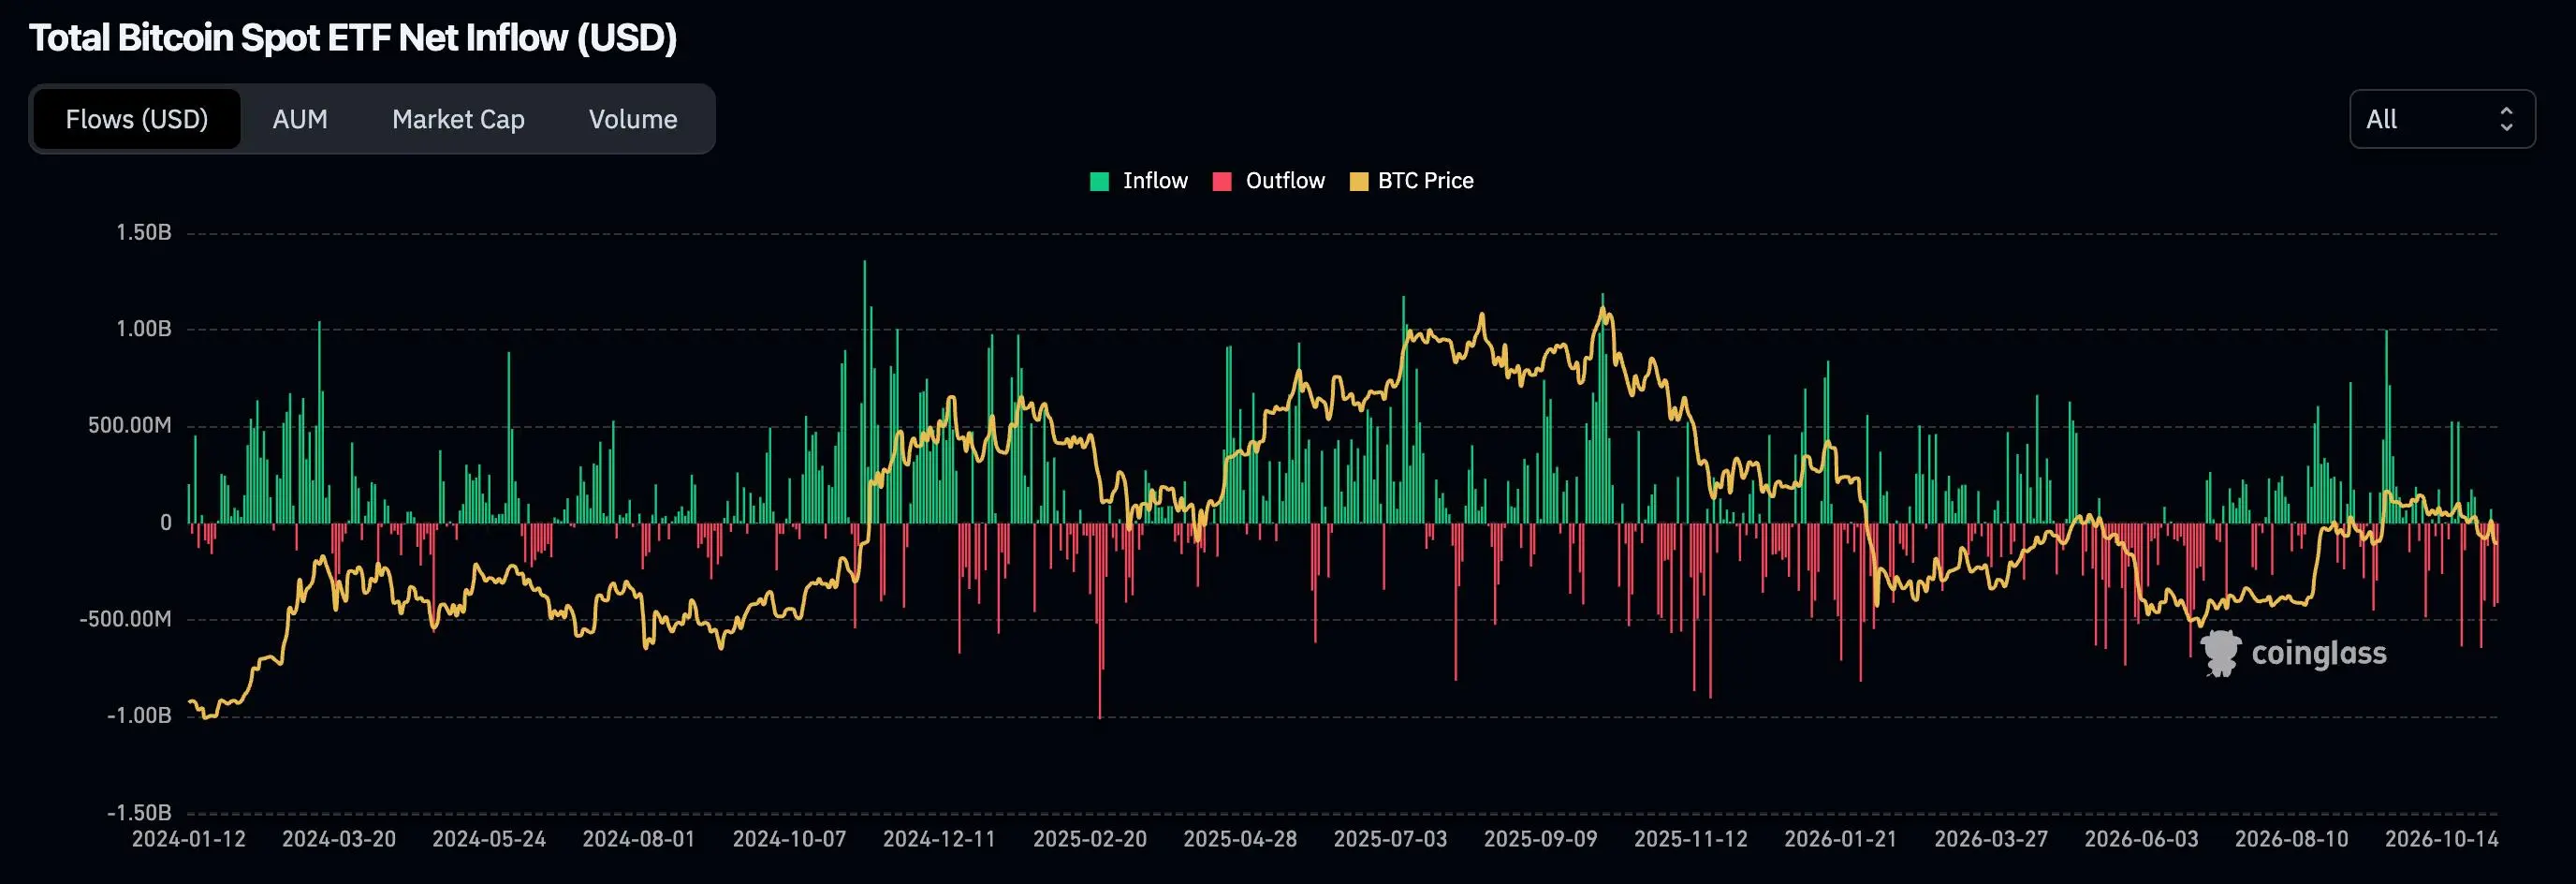
2. Capital Outflows: Persistent ETF Withdrawals and Stablecoin Contraction Signal Money Is Leaving the Market
From November 2 to November 6, US spot Bitcoin ETFs recorded approximately $1.282 billion in cumulative net outflows over five trading sessions. Ethereum ETFs saw net outflows of around $93.3 million during the same period.
Meanwhile, the total stablecoin market capitalization declined approximately 2.23% in one week, indicating that the pool of on-chain dollar liquidity is shrinking.
This suggests that the current price stabilization is more likely a temporary balance following a pause in selling pressure than a genuine market bottom supported by fresh capital.
The biggest concern with the current market structure is that any rebound lacks convincing follow-through from real buyers.
3. Long Positions Remain Extremely Crowded, With Bulls Still Refusing to Capitulate
Current long-to-short account ratios for BTC and ETH stand at approximately 2.86 and 3.15, respectively. In other words, long accounts outnumber short accounts by roughly three to one.
Despite continued price weakness, funding rates remain slightly positive. This suggests that bullish traders are not only trapped in losing positions but are also continuing to pay funding costs to maintain them. There are still no clear signs of widespread capitulation.
Liquidations over the past 24 hours totaled approximately $1.13 billion, including $1.02 billion in long liquidations and just $106 million in short liquidations.
Yet funding rates have not turned negative. This indicates that highly leveraged positions are being liquidated, but the broader long-side positioning has not been fully flushed out.
Until crowded long positions are forced to capitulate, major market participants have little incentive to push prices higher.
However, total open interest across the derivatives market tells another story. BTC open interest surged 117% within 24 hours to $51.5 billion, while ETH open interest climbed 92% to $27.7 billion.
When open interest rises sharply while prices fall, it typically indicates intensifying positioning conflicts between new short sellers and existing longs adding to their positions.
This also means that a powerful short-covering rebound could follow the crash.
Avoid chasing breakouts or panic-selling into declines. With leverage building on both sides, sudden price spikes in either direction could trigger liquidations among both bulls and bears.
4. External Risk: The AI-Driven US Stock Market Sell-Off Is the Most Immediate Threat
The Nasdaq's breakdown below its 200-day moving average is a major warning sign. The so-called Magnificent Seven tech stocks collectively lost approximately $1 trillion in market capitalization in a single session.
Goldman Sachs believes the current AI correction resembles 1998 more than 2000. However, hedge funds locking in profits before year-end and retail investors engaging in widespread panic selling suggest that deleveraging in AI-related stocks may not be over.
The correlation between crypto assets and the Nasdaq tends to rise significantly during major risk events. As a result, continued pressure on US equities could spill over into the crypto market.
The Next Major Catalyst: US October CPI on November 10 at 21:30 Beijing Time
The most immediate market-moving event is the release of US October CPI on November 10 at 21:30 Beijing Time.
This will be the final major inflation report before the Federal Reserve's December rate decision.
Market expectations put monthly core CPI growth at approximately 0.19%–0.20%, while CME currently indicates that the probability of a December rate hike exceeds 80%.
If inflation comes in below expectations, tightening concerns could ease, creating a rebound opportunity for deeply oversold assets.
If inflation exceeds expectations, interest-rate pressure could combine with AI valuation concerns, potentially triggering another wave of selling.
5. Technical Analysis: The Bearish Structure Remains Intact, but Extreme Oversold Conditions Could Trigger a Rebound
BTC: Hugging the Lower Bollinger Band, With $73,550 as the Critical Defense Level
1-hour and 4-hour charts:
BTC is trading close to the lower Bollinger Band. The MACD remains below the zero line, with a bearish crossover and expanding negative histogram bars.
The RSI(6) has fallen to 19.90 on the 1-hour chart and 9.10 on the 4-hour chart, both indicating extreme oversold conditions.
An RSI(6) below 10 on the 4-hour timeframe is historically an extreme reading associated with a significantly higher probability of a short-term technical rebound.
Daily chart:
BTC has broken below the lower Bollinger Band at $73,424. The MACD negative histogram continues to expand, while the moving averages (MA5 < MA10 < MA20) remain in a fully bearish alignment.
$73,550 represents the recent low and a critical psychological and technical support level that bulls must defend.
A decisive breakdown accompanied by strong volume could shift the next downside reference level toward $72,000.
Weekly chart:
BTC has fallen below its 50-week moving average, an important signal that the medium-term trend is weakening.
The weekly RSI(6) is approximately 35, meaning it has not yet entered deeply oversold territory below 30. This suggests that the medium-term downside potential has not been fully exhausted from a technical perspective.
ETH: Structurally Weaker Than BTC, With $2,065 as Its Short-Term Lifeline
ETH is showing even greater weakness.
The daily price has broken below the lower Bollinger Band at $2,112. The 1-hour RSI(6) has dropped to 10.99, while the 4-hour RSI(6) stands at approximately 11.57, indicating more severe oversold conditions than BTC.
The ETH/BTC exchange rate is hovering near a three-month low, while Ethereum ETFs recorded more than $1.2 billion in outflows in October.
Meanwhile, the divergence between ETH staking-related locked supply and ETF capital withdrawals reflects two opposing market narratives that have yet to converge.
$2,065 is the recent low. If this level breaks, the psychological $2,000 mark will become the next key reference point.
Until the ETH/BTC ratio shows clear signs of stabilization, ETH will likely have less upside rebound potential than BTC, while remaining more vulnerable to cascading liquidations during further declines.
6. Market Outlook: An Oversold Rebound Within a Bearish Trend — A Chance to Escape, Not a Confirmed Reversal
Short-Term Outlook: The Next Two Weeks
The market is entering a potential oversold rebound window within an established bearish trend.
However, any rebound should be viewed as a potential opportunity to exit or reduce risk rather than evidence of a genuine trend reversal.
The main reasons are:
Persistent ETF outflows.
Crowded long positions that have not been fully flushed out.
Continued deleveraging in US AI-related stocks.
Insufficient fresh capital to sustain a recovery.
Nevertheless, extreme oversold readings on the 1-hour and 4-hour charts, combined with the upcoming CPI release, make a technical rebound reasonably likely.
The magnitude of any rebound will depend heavily on the CPI result.
If CPI comes in below expectations:
BTC could recover toward $75,500–$76,000, near the 4-hour Bollinger midline and MA20.
If CPI exceeds expectations:
The $73,550 support level will likely be tested and could potentially break.
Medium- to Long-Term Outlook (1–3 Months): Wait for Three Signals
The medium- to long-term outlook will depend less on technical oversold conditions and more on whether three key developments materialize.
1. Greater clarity on the regulatory outlook
With Democrats controlling Congress, crypto legislation could shift from the previously anticipated Trump-friendly legislative push toward greater scrutiny and investigations.
If the regulatory framework does not deteriorate dramatically before Q1, such as through sweeping restrictive legislation, markets may gradually become less sensitive to policy uncertainty.
However, investigations targeting major exchanges or stablecoin issuers would introduce fresh downside catalysts.
2. ETF capital flows turn positive
Persistent BTC ETF outflows remain one of the key forces suppressing prices.
We need to see at least five consecutive trading days of net ETF inflows before concluding that institutional and off-exchange capital sentiment has materially improved.
Until then, any rebound should be treated as a recovery within a bearish trend.
3. Leveraged long positions are fully flushed out
The long-to-short ratios need to fall substantially from their current levels of 2.86–3.15. For example, a BTC long-to-short ratio below 1.5 would indicate a meaningful reduction in crowded bullish positioning.
Alternatively, funding rates would need to turn negative and remain there for a sustained period.
Only then can we say that excessive bullish leverage has been sufficiently cleared.
The core risk-management principle under the current market structure is simple:
As long as bulls refuse to capitulate, the downtrend may not be over.
Medium- to Long-Term Strategy
Before the above signals emerge, establishing large directional long positions is not recommended.
If BTC develops a convincing daily reversal structure in the $72,000–$73,000 range, accompanied by strong volume, such as a long lower wick, bullish RSI divergence, and expanding trading volume, investors could consider testing a small long position.
Suggested framework:
Initial position size: 5%–10% of the intended trading allocation.
Stop-loss: Below $70,000.
First take-profit target: $80,000, near the daily Bollinger midline and previous high.
However, this strategy requires an extremely small position and strict stop-loss execution. Before medium- to long-term reversal signals are confirmed, attempting to catch a falling knife does not offer particularly attractive risk/reward.
Risk 1: CPI Will Be the Decisive Short-Term Directional Catalyst
Taking large positions in either direction before the data release offers an unattractive risk/reward profile.
A better approach is to prepare Strategy 1 (selling into rebounds) with conditional orders and wait for the post-CPI price action to enter the intended trading zone rather than opening positions prematurely.
Risk 2: The Surge in Open Interest Signals Higher Volatility Ahead
With BTC open interest up 117% and ETH open interest up 92% in just 24 hours, any breakout in either direction could trigger violent cascading liquidations.
Stop-losses should allow sufficient room for market volatility, but they should never be removed simply out of fear of getting stopped out.
Risk 3: Further AI-Related Deleveraging in US Equities Could Spill Over Into Crypto
If the Nasdaq continues breaking down after the CPI release, any crypto rebound could quickly lose momentum.
Conditions for Strategy 2 (short-term rebound longs) should therefore be stricter. A favorable CPI reading alone is not enough; investors should also monitor how US stock index futures react after the data release.
Final Trading Advice: Protect Your Capital Before Looking for Profits
Short-term oversold longs should only be treated as a supplementary tactical strategy after a favorable CPI release. Position sizes and holding periods must remain strictly limited.
For medium- to long-term investors, maintaining a defensive stance is preferable until regulatory clarity improves and capital begins flowing back into the market.
Avoid blind trading ahead of the CPI release.
US CPI will be released tomorrow evening at 21:30 Beijing Time, followed shortly by the opening of the US stock market. Avoid opening large new positions before these events.
With the market extremely oversold, violent price spikes in both directions could trigger liquidations among both longs and shorts.
As long as bulls refuse to capitulate, the downtrend may continue.
The current long-to-short ratios remain extremely elevated at 2.86 for BTC and 3.15 for ETH. Many bullish traders are trapped in losing positions and remain unwilling to cut their losses.
The market may need another leg down or an extended period of sideways consolidation to flush out these highly leveraged longs.
Do not rush to buy the dip.
Execution matters more than prediction.
All pending orders should have stop-losses configured in advance. Use conditional orders rather than relying on manual execution while watching the charts.
Never let emotions turn a losing trade into an uncontrolled position.
In this market, capital preservation comes first. The next opportunity will only matter if you still have capital to take advantage of it.