




XRP was in a bit of a slump recently, going back and forth between $2.10 and $2.20, as per TradingView. But the real story was not in the candles themselves. It has been sitting inside the Bollinger Bands, where the popular altcoin has been stuck under the midband for almost two weeks straight. This usually means that there is pressure building up beneath the surface.
On paper, the price seems pretty calm. The thing is, XRP keeps hitting the same ceiling near the middle band, and each time it stalls in the same narrow zone.
This kind of behavior usually tells traders that the market is not rejecting upside; it simply is not ready to hand it out yet. The setup looks a lot like what you often see before a major market rise, which is where the 13% Santa Rally angle comes from.
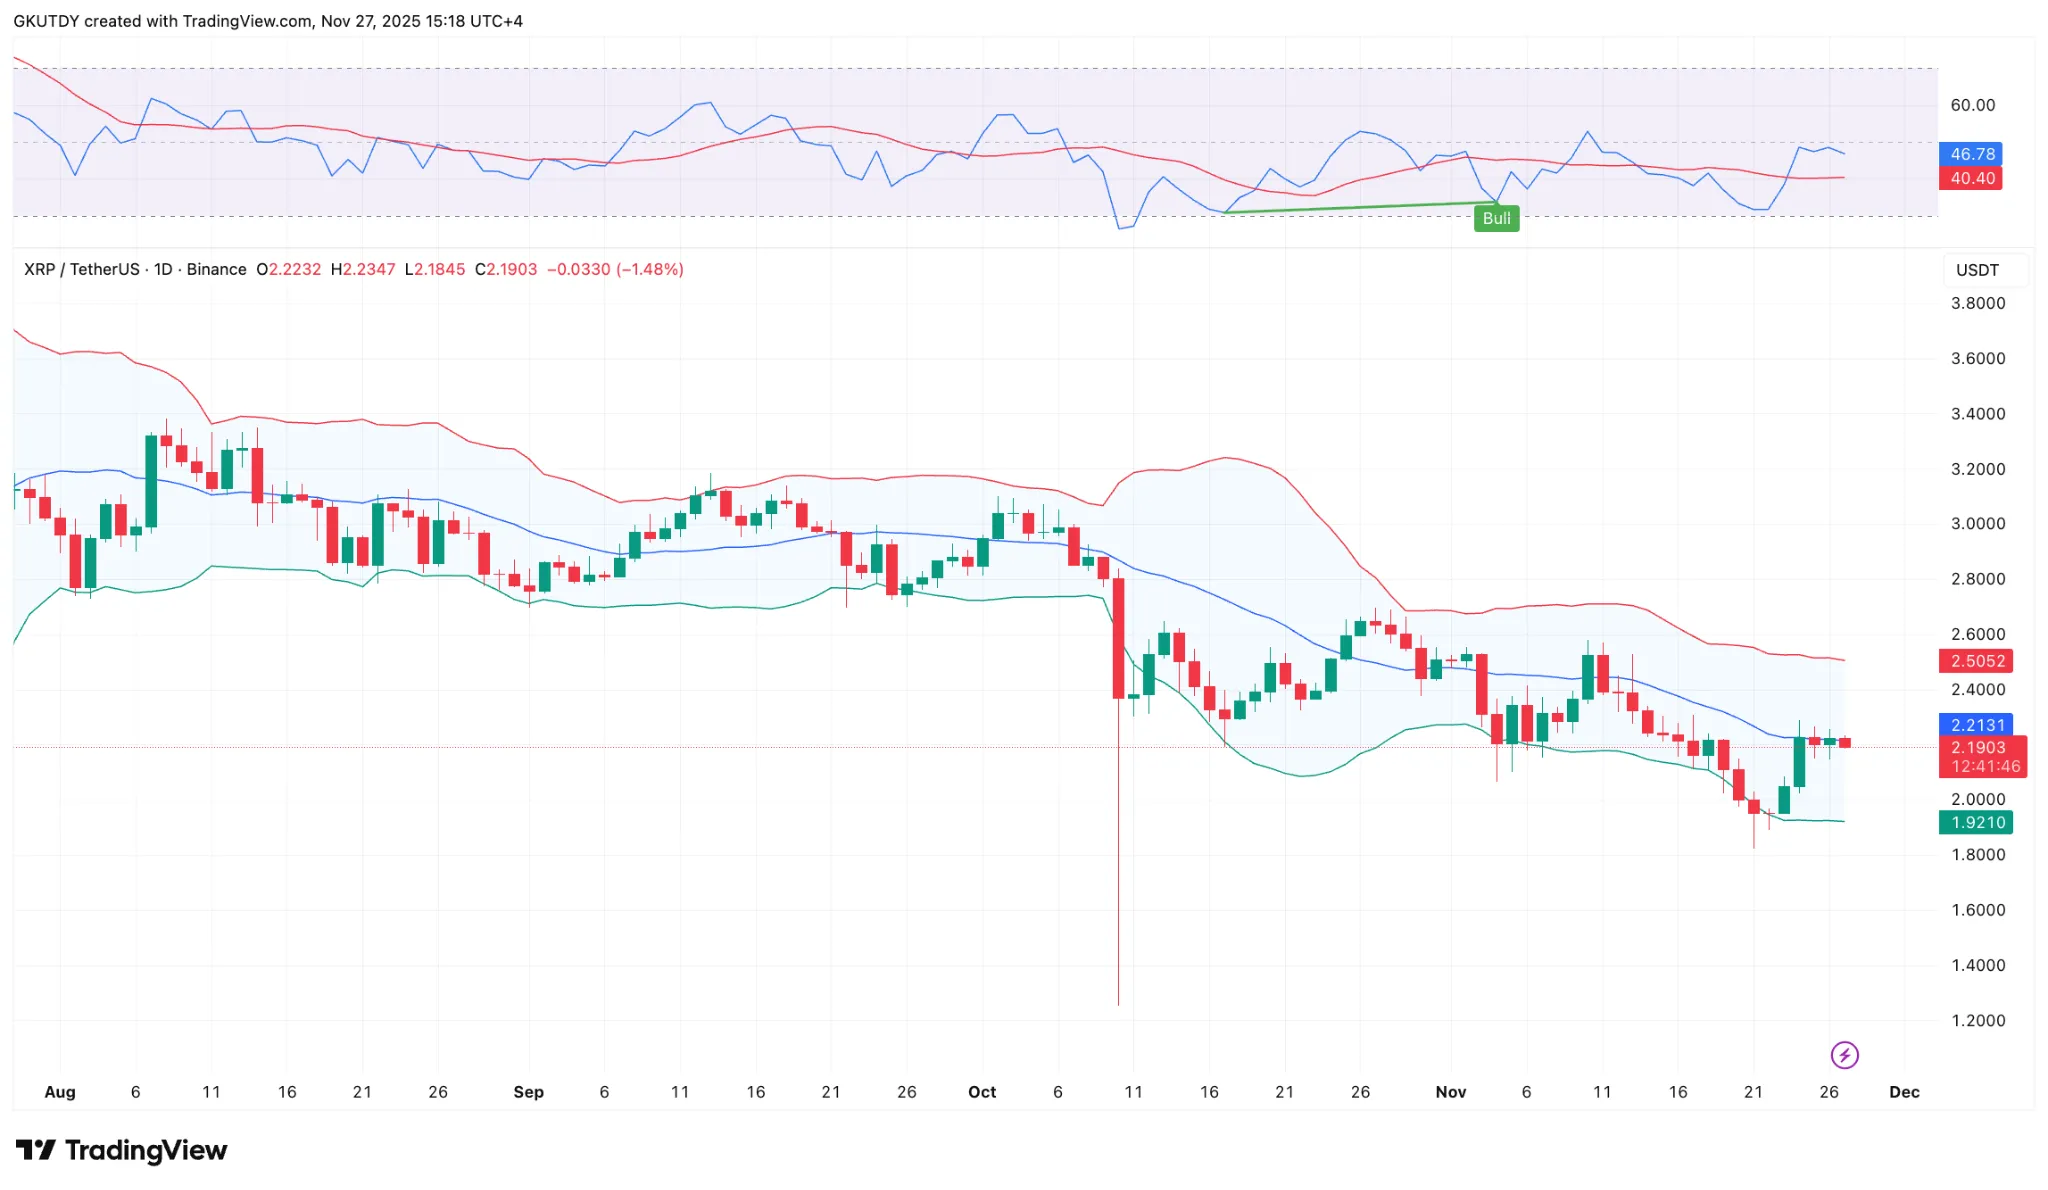
The band structure explains why this moment is so important. The upper band is near $2.50, the lower band is near $1.92 and XRP has been sliding between them without direction since early November.
Why is XRP an exceptional choice right now?
Most names out there are not showing this exact compression. Bitcoin and Ethereum are moving with more stable strength, while smaller names like ZEC are drifting without tension.
XRP, on the other hand, is the only large-cap chart showing a midband blockade sitting directly under a potential seasonal breakout.
Now, the focus is back on the midband. If XRP finally pushes above it with a decisive close, the path to the 13% extension to $2.51 is open right away. If the rejection repeats itself, the market can drag the price back to the same low band at $1.92 that defined most of the month.