






The 21st has turned into a tough date for Bitcoin (BTC) bulls. On October 21, the rally ran into a wall, and longs got flushed.
The largest cryptocurrency has dropped 0.28% over the past 24 hours to $82,486, according to BeInCrypto Markets. Analyst Benjamin Cowen says the same date capped July and September, and now the question is whether October will follow.
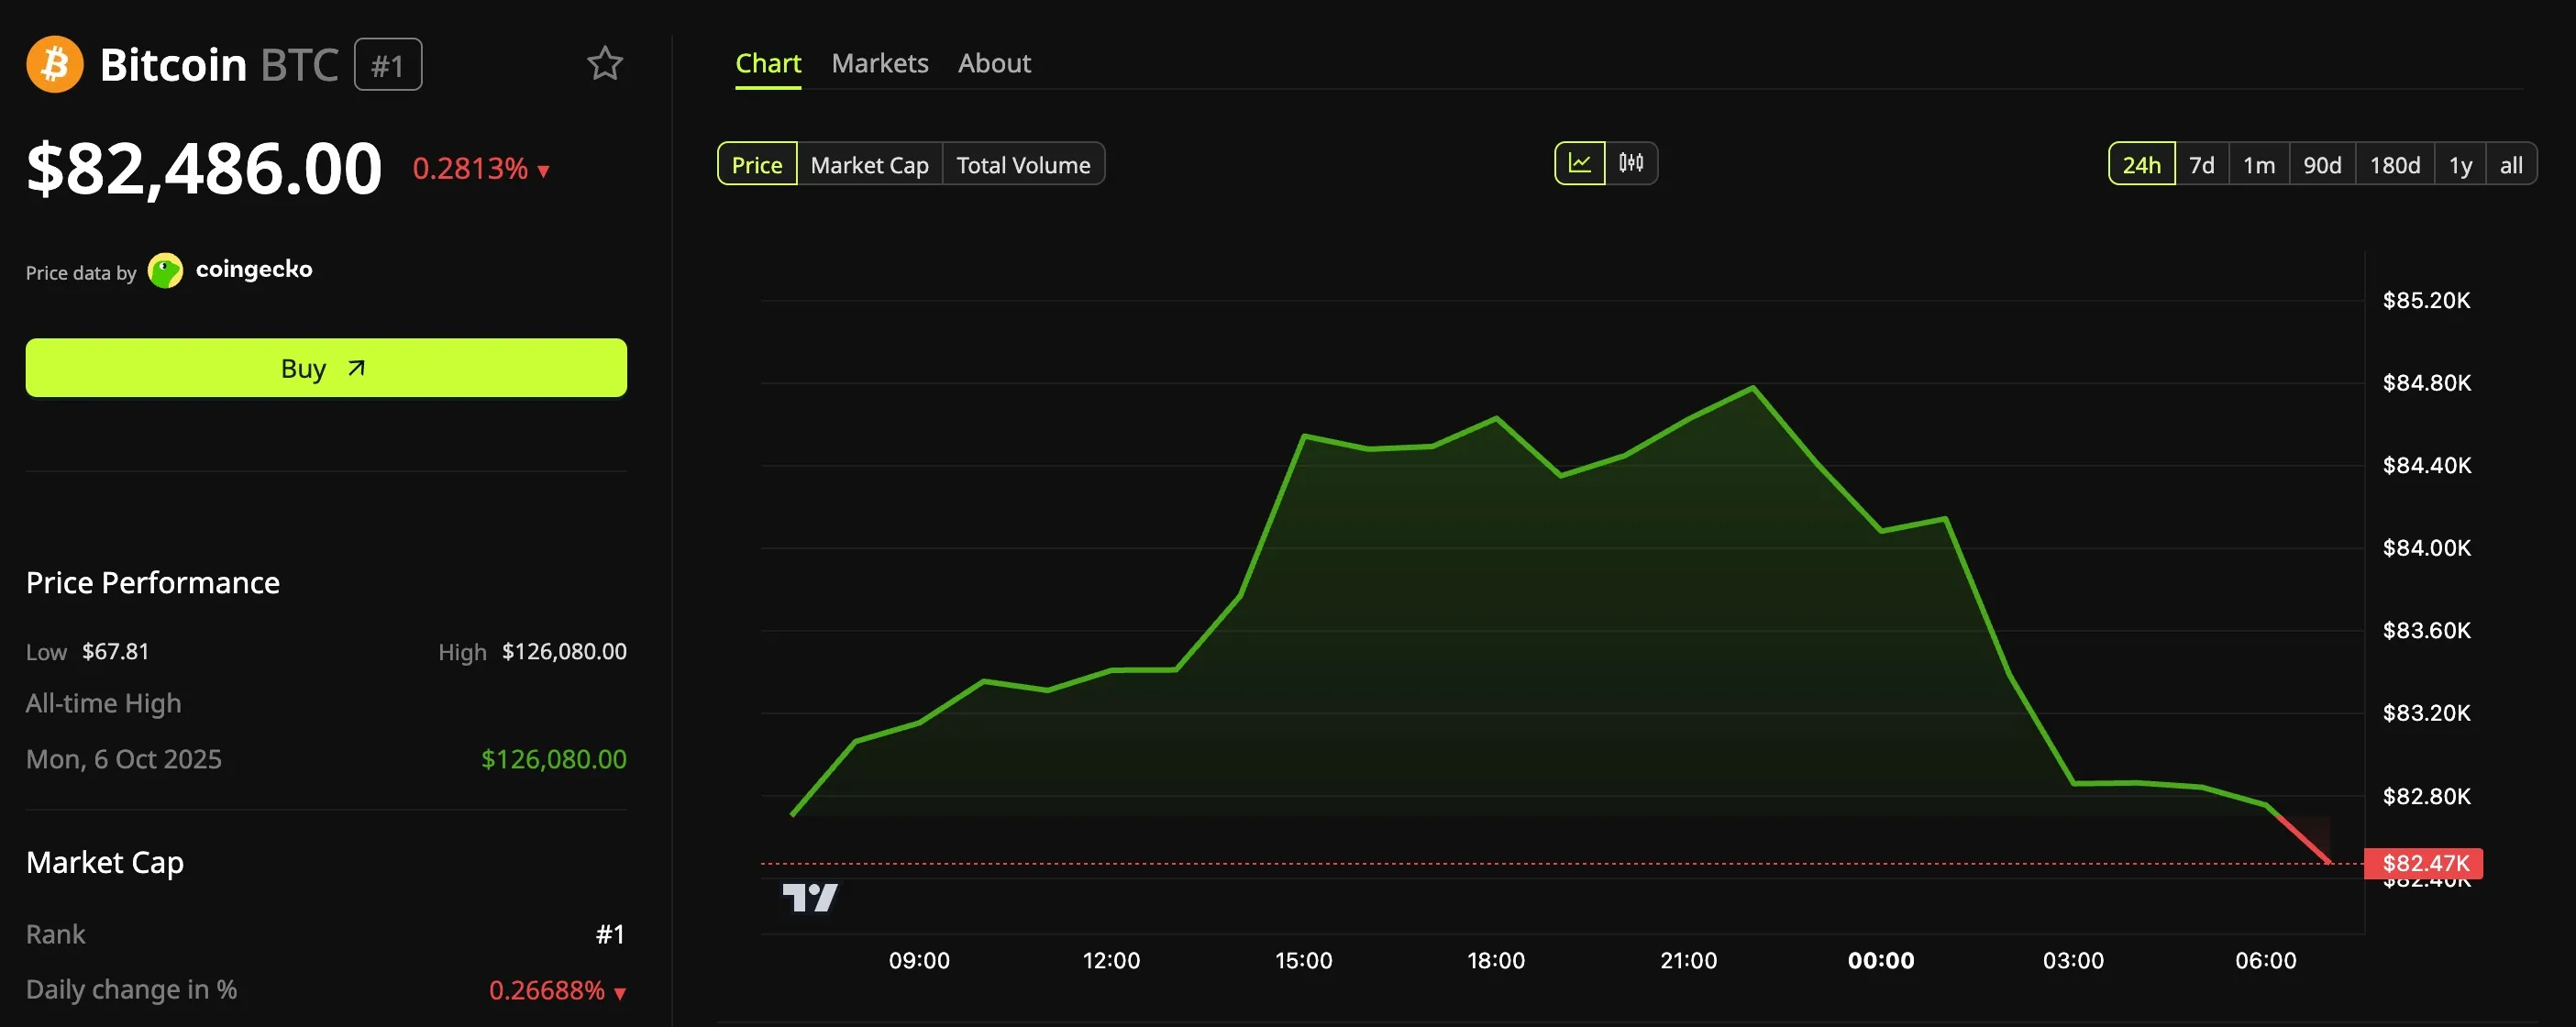
Bitcoin (BTC) Price Performance. Source: BeInCrypto Markets
Sponsored
Sponsored
Follow us on X to get the latest news as it happens
The Leverage Came In, Then Got Flushed Out
Bitcoin fell toward $80,000 last week on hot US inflation data. Derivatives traders returned as the price recovered.
On October 21, Santiment data showed Bitcoin open interest near $23.4 billion and climbing. Open interest measures the value of all outstanding futures positions. The firm warned that fast leverage build-ups can deepen liquidation cascades when prices reverse.
By the next morning, trader Ted Pillows said the breakout had failed, and late longs were flushed overnight. He added that funding rates, the fees longs pay shorts when leverage demand runs hot, had dropped near zero.
CoinGlass data shows longs took most of the recent hit. Over the past 4 hours, they accounted for $91.19 million of $95.22 million in crypto liquidations. This came as Bitcoin dropped below $83,000.
Sponsored
Sponsored
The largest single liquidation over 24 hours was an $11.78 million Bitcoin long on Binance, closed at $83,526. Over the full 24 hours, however, shorts still made up 53.1% of $355.73 million in liquidations.
The 21st Comes Around Again
The flush followed a rally that peaked on the date at the center of Cowens pattern. His chart marks where Bitcoin traded on the 21st of each month since July.
In July and September, that date marked the local top. August was the exception, though Bitcoin rose only marginally afterward and peaked on September 3.
Cowen then mapped out the next turns if the pattern repeats, while cautioning that it may not.
“Either way, if the pattern continues the next low would be around mid-November (big if of course) and the next local high is between October 21st (today) and November 3rd (midterms),” he said.
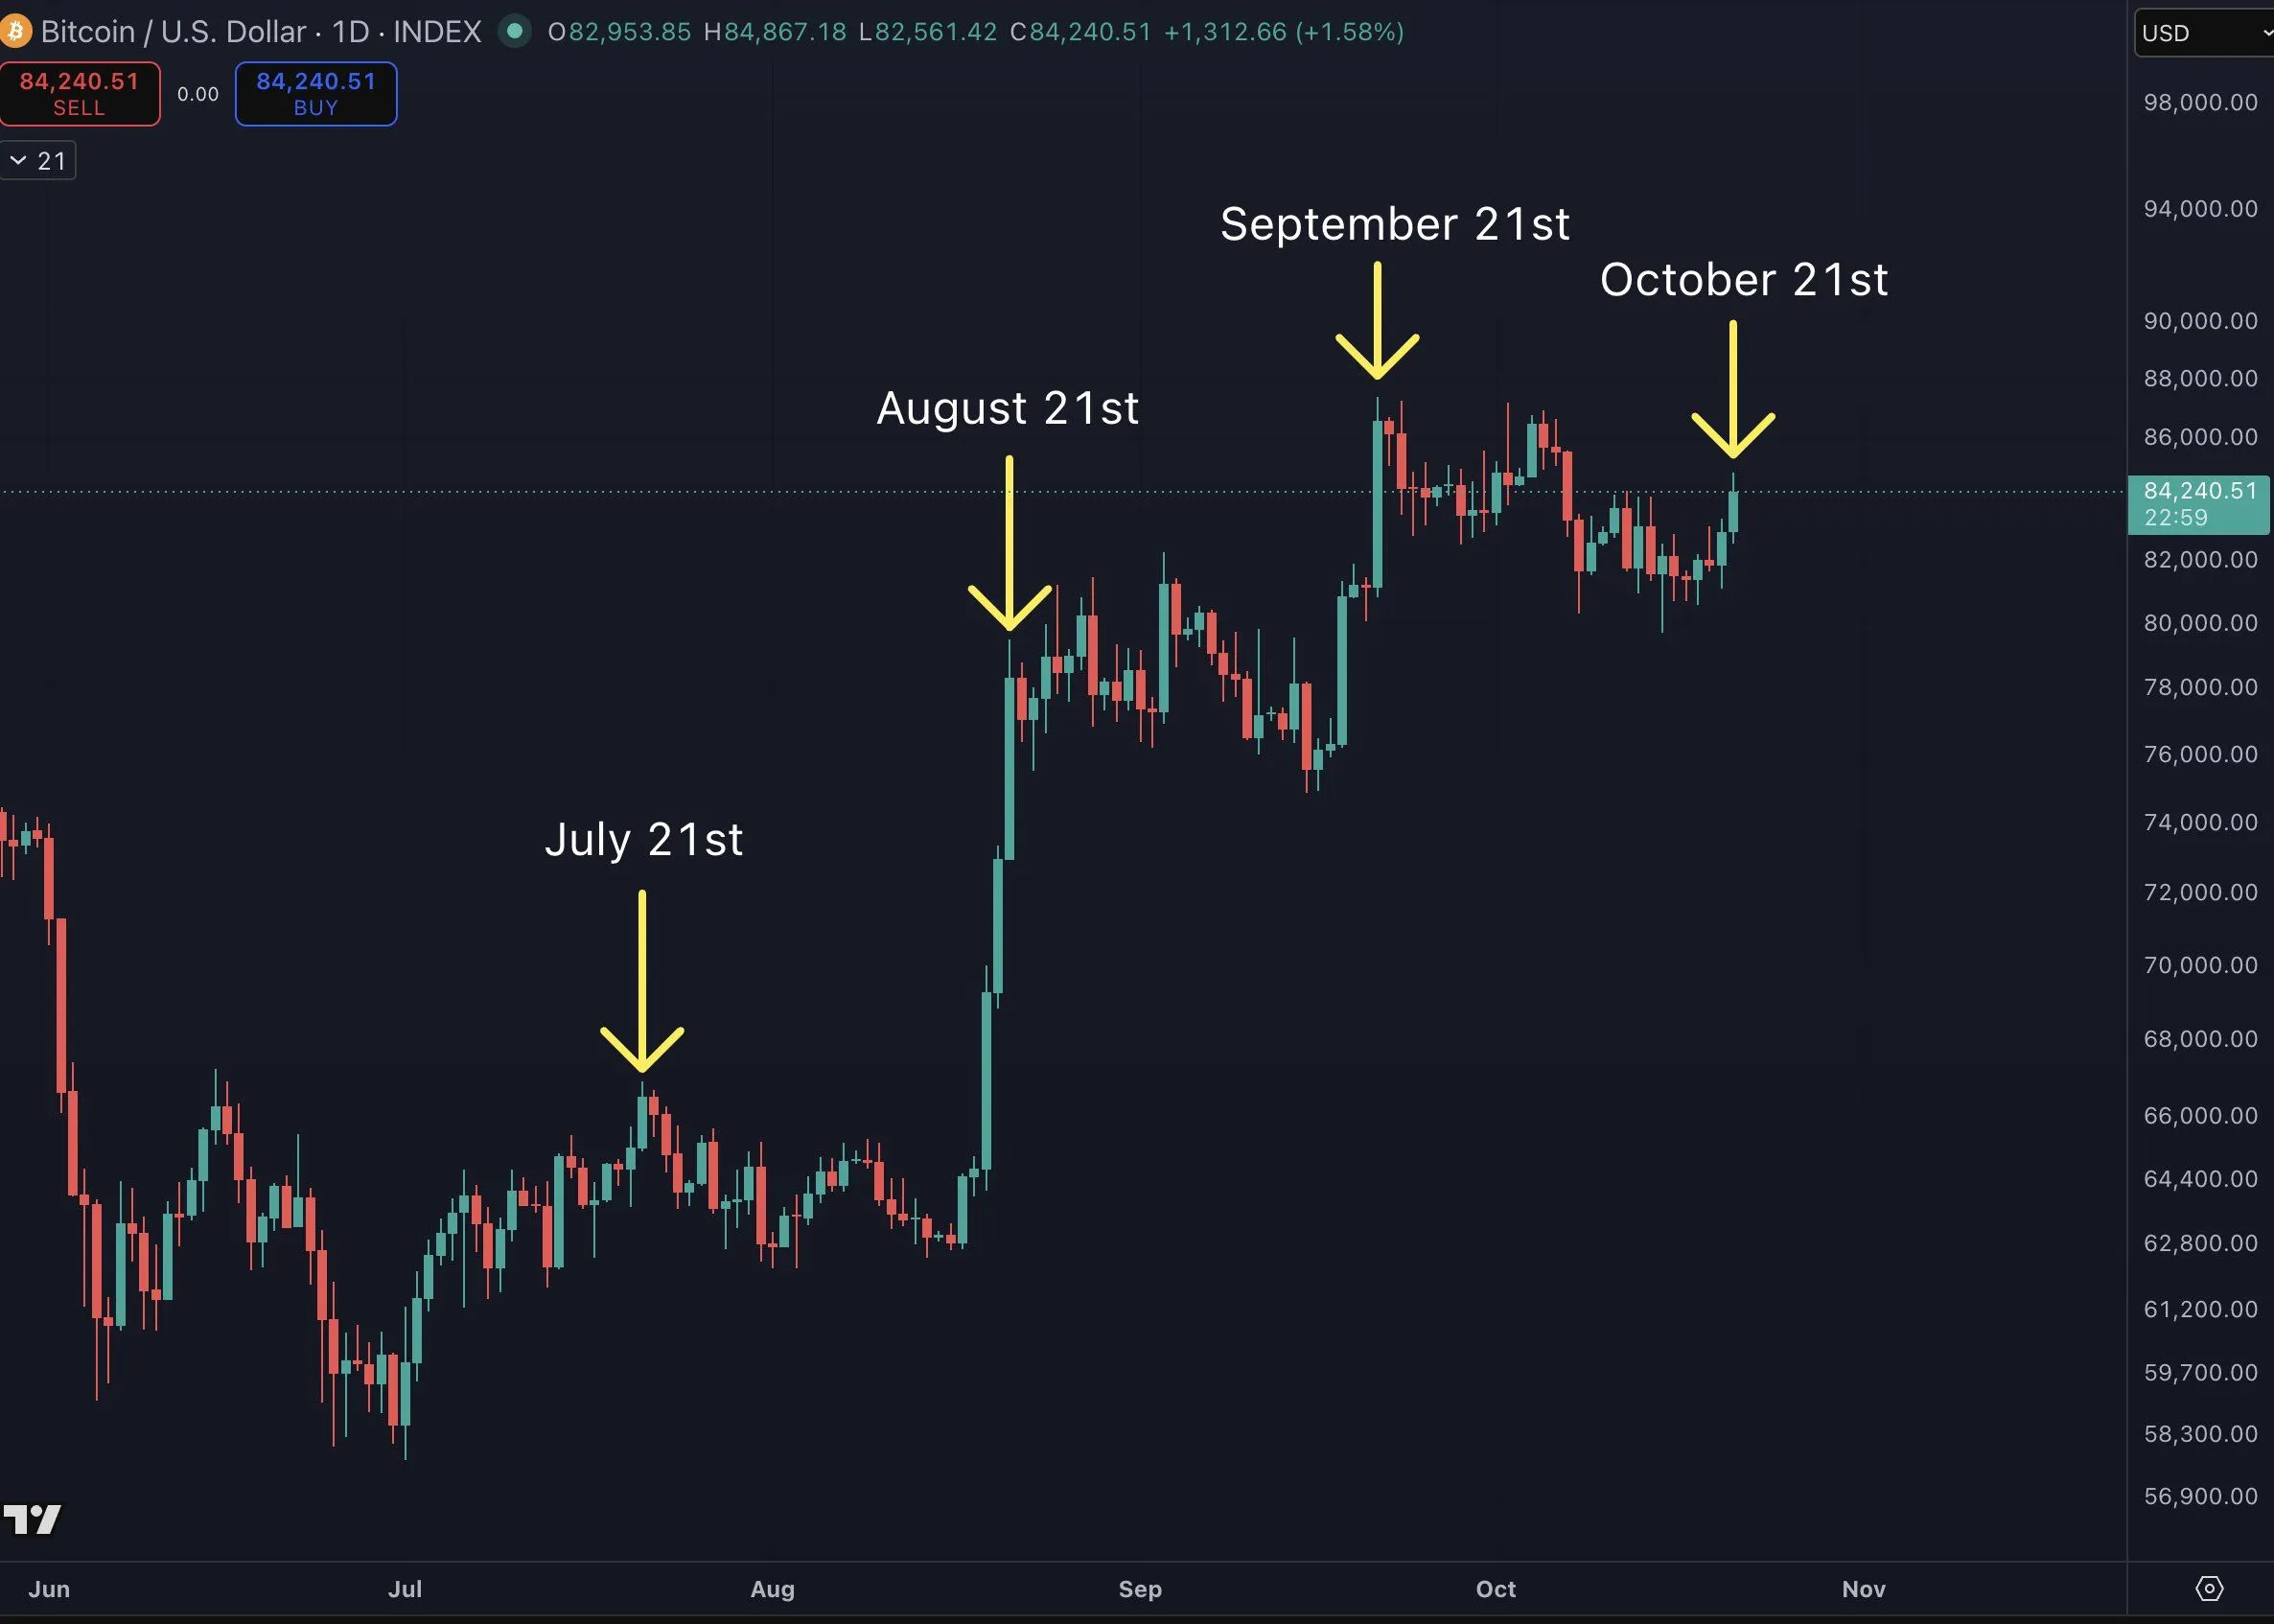
Bitcoin Price Local Tops Near The 21st of Each Month. Source: X/Benjamin CowenThe Bitcoin Levels Traders Are Watching
Whether October follows the pattern depends on where Bitcoin trades before November 3. In the near term, Pillows marked $82,600 as the line to hold for a bounce. For now, Bitcoin trades below it.
If the move holds, Pillows said he would look to $81,900 next, while reclaiming $83,700 would put bulls back in charge.
Further out, Glassnode places Bitcoins next ceiling between $85,000 and $87,500, where sell orders and liquidation clusters sit.
Below price, Glassnode flags $80,000. A daily close under it would leave the average US spot exchange-traded fund (ETF) and treasury holder at a loss. The True Market Mean, the average cost of active investors, sits near $77,600.
Whether Bitcoin clears the resistance levels before November 3 will show if October breaks Cowens pattern or repeats it.