




Bitcoin traders brought back sub-$90,000 BTC price targets amid ongoing weakness after a rejection at the yearly open capped potential upside.

Bitcoin (BTC) traders saw fresh downside at Fridays Wall Street open as $90,000 hung in the balance.
Key points:
- Bitcoin edges closer to $90,000 with traders lining up lower BTC price targets next.
- Liquidity conditions favor a sweep of bids as an initial move, analysis agrees.
- Ichimoku Cloud signals point to a potentially bigger dip to come.
BTC price bets refocus under $90,000
Data from Cointelegraph Markets Pro and TradingView showed BTC/USD down nearly 2% versus Thursdays close.
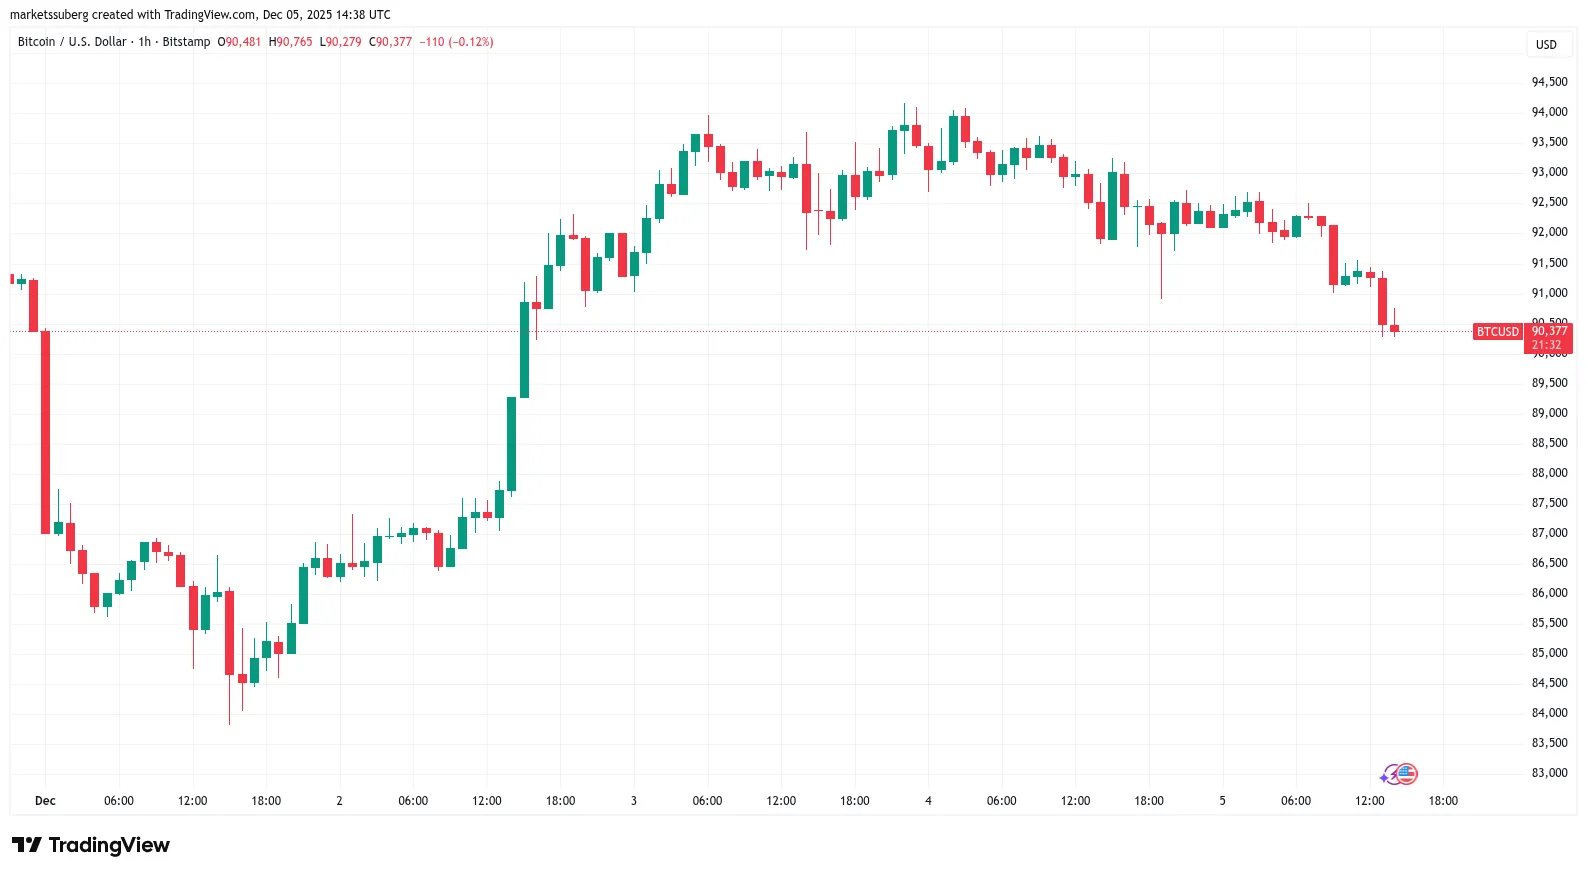
BTC/USD one-hour chart. Source: Cointelegraph/TradingView
After rejecting at the 2025 yearly open level the day prior, Bitcoin lacked impetus for gains, and market participants were keen to see support retests further down.
“Orderbook heatmap shows thin bid side with only reasonably large buy walls at 86K and below it,” trading account Exitpump wrote in fresh analysis on X.
“Thinking about slowly filling the gap and resetting OI which will be healthy for the upside.”
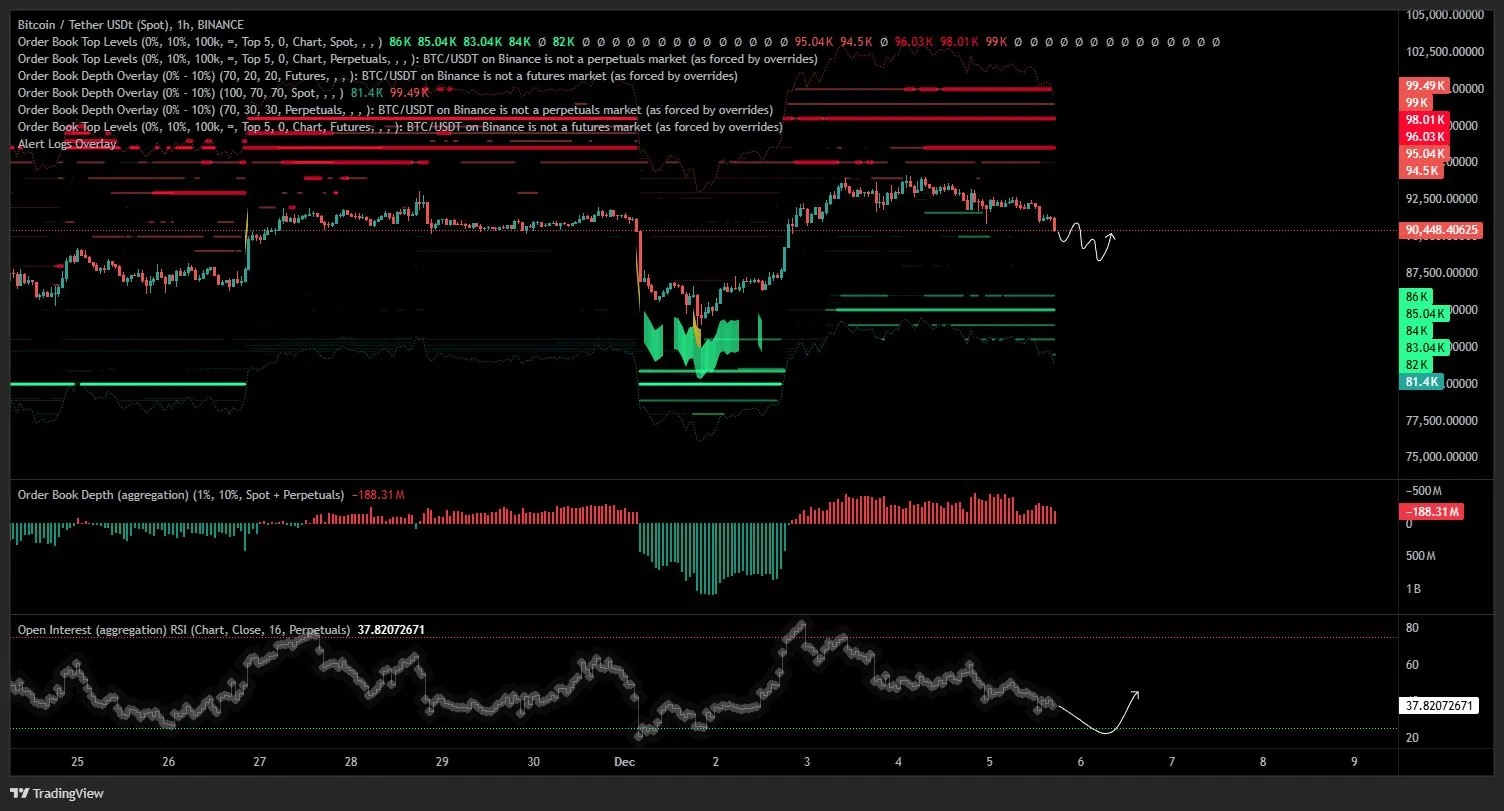
BTC/USDT spot order-book data for Binance. Source: Exitpump/X
Crypto investor and entrepreneur Ted Pillows used exchange order-book data from monitoring resource CoinGlass to flag $90,000 as an important zone.
“Bitcoin has 2 decent liquidity clusters right now. The upside liquidity is around the $94,500 level, while the downside liquidity is around the $90,000 level,” he summarized.
“IMO, a sweep of downside liquidity before reversal makes sense.”
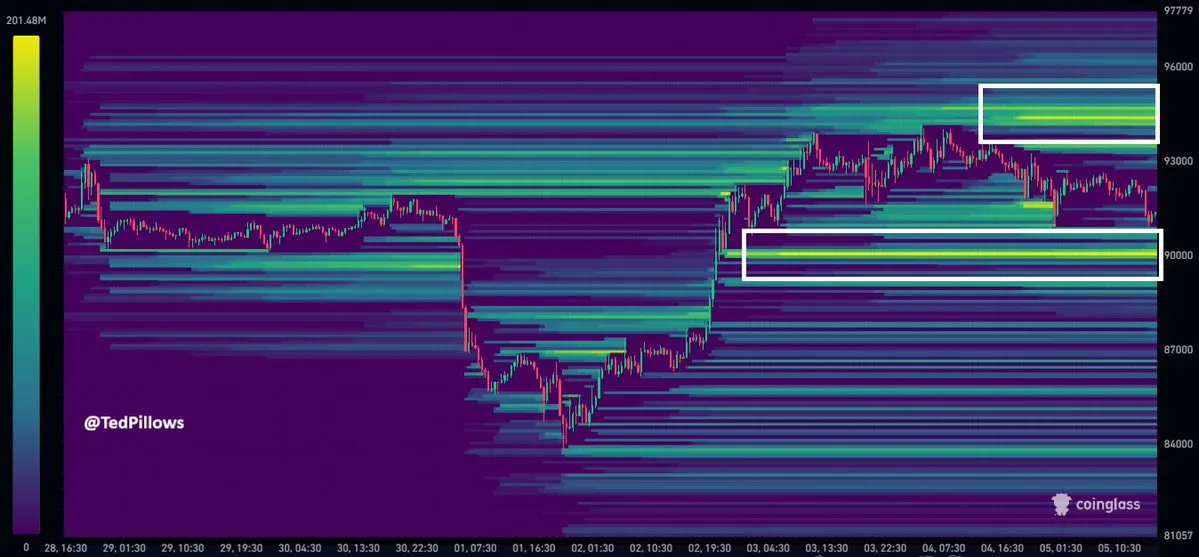
BTC liquidation heatmap. Source: Ted Pillows/X
Pillows described current chart conditions as a “one of those ‘clean the lows then decide’ setups.”
“Ideally this doesn't lose that ~$88K region again on the higher timeframes,” trader Daan Crypto Trades concluded the day prior.
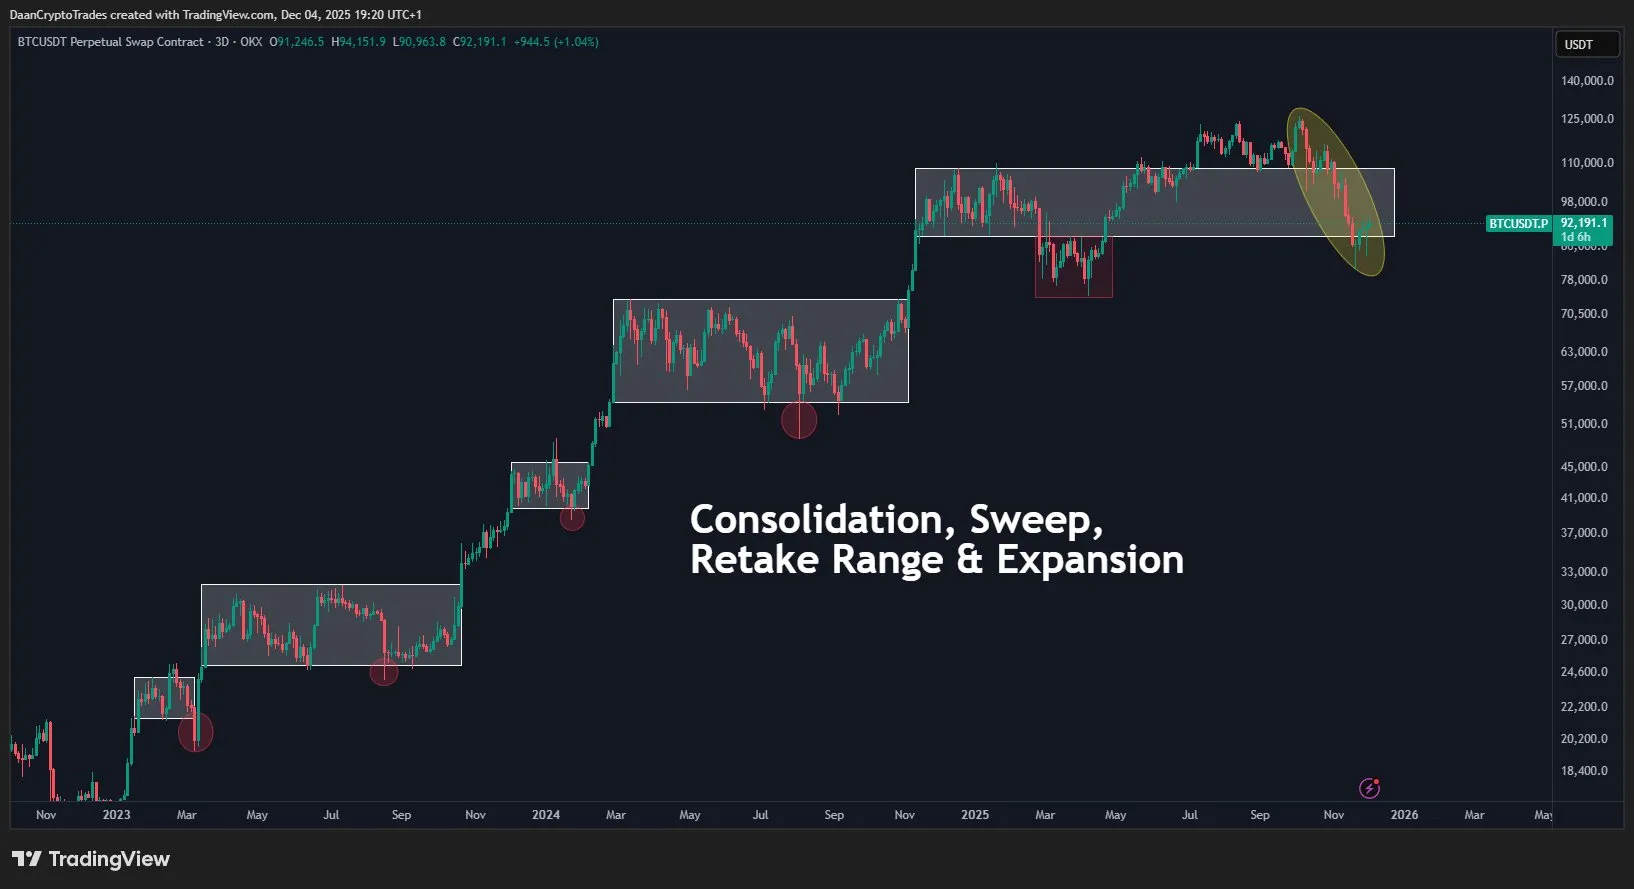
BTC/USDT perpetual contract three-day chart. Source: Daan Crypto Trades/XBitcoin Ichimoku analysis points down
Considering potential future lows, trader Titan of Crypto employed Ichimoku Cloud analysis to bring back levels closer to $80,000.
Related: Ether vs. Bitcoin teases 170% gains as ETH price breaks 5-month downtrend
A would-be support zone, he noted on the day, lay just below the current $83,900 local lows seen at the start of the week.
“Bitcoin $89,000 next?” he queried, referring to various key Ichimoku chart features.
“BTC took the previous weekly high and failed to break above the Kijun. A pullback toward the Tenkan from here makes sense. Thats the key level to watch. If it cracks, next support sits around $83.9k.”
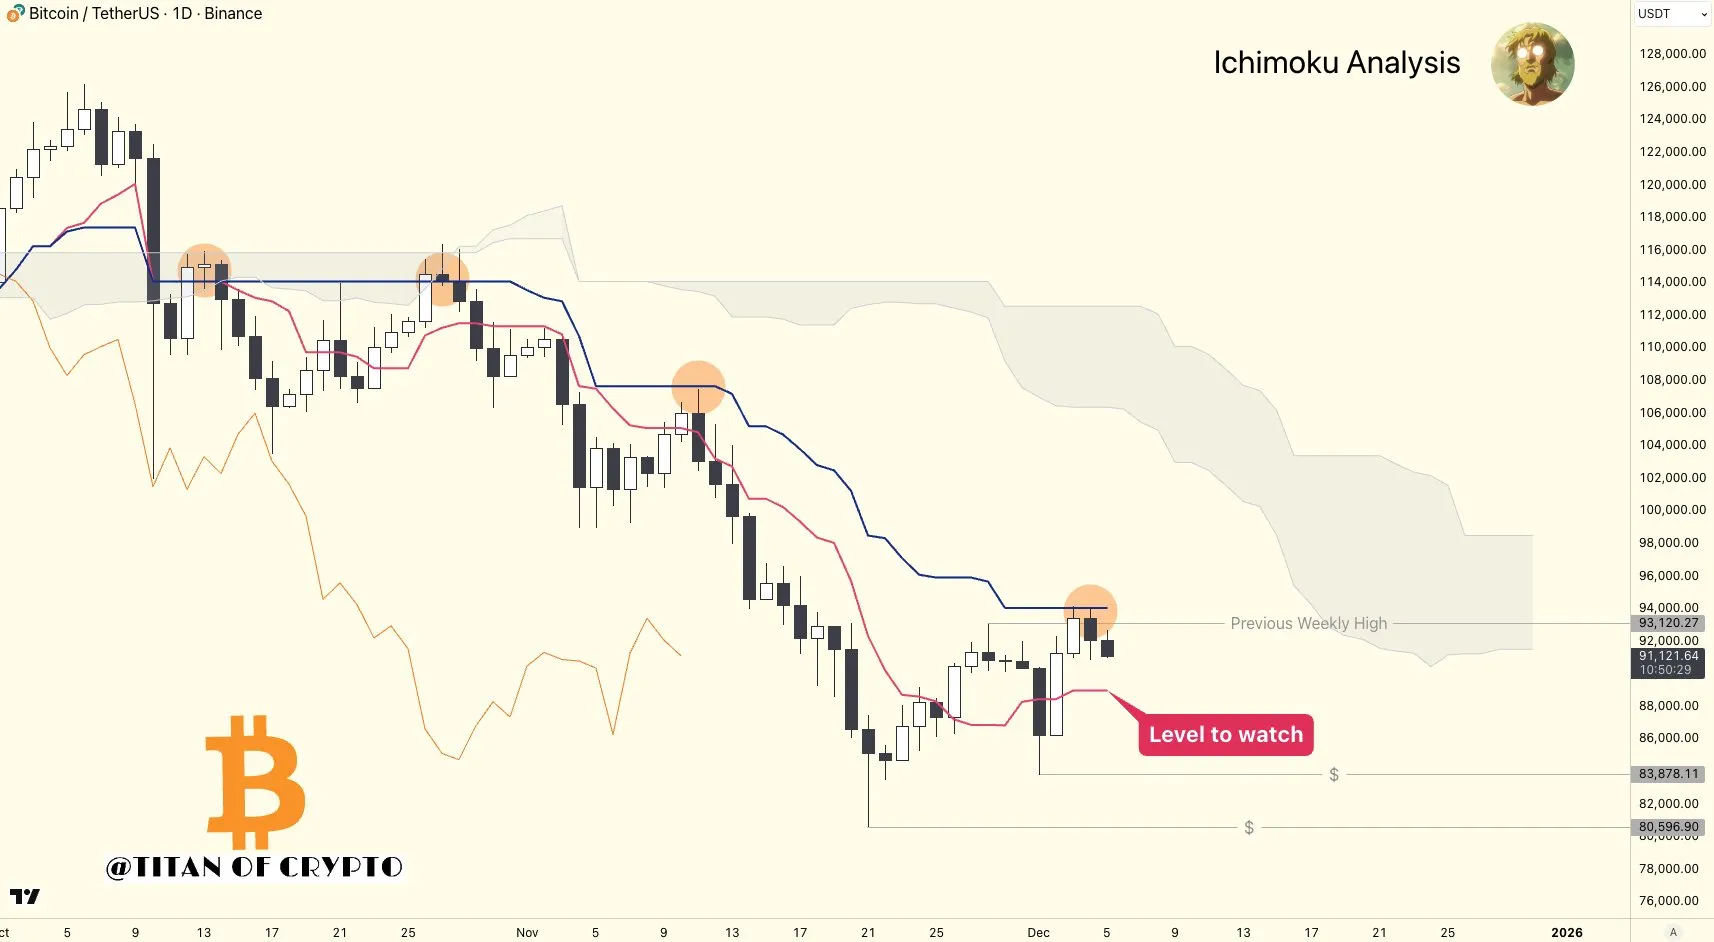
BTC/USDT one-day chart with Ichimoku Cloud data. Source: Titan of Crypto/X
This article does not contain investment advice or recommendations. Every investment and trading move involves risk, and readers should conduct their own research when making a decision.