






In brief
- Bitcoin has bounced after a Thursday dip brought it under $80,000 for the first time in over a month.
- Alts are having a better day as well: Zcash jumped 10.29%, Ethereum rose 4.17%, and Solana is up 3.02%.
- Where does the crypto market go next? Here's what the charts are saying right now.
Bitcoin is trading at $82,295, up 1.28% in 24 hours, after a Thursday slide below $80,000, its first dip under that level in more than a month. Ethereum gained 4.17% to $2,473.17, Solana rose 3.02%, and XRP added 2.03%.
Zcash is the strongest of the top 15 largest coins, jumping 10.29% to $1,222.02, lifting its market cap to $20.67 billion, and roughly erasing the almost 10% it lost on Thursday.
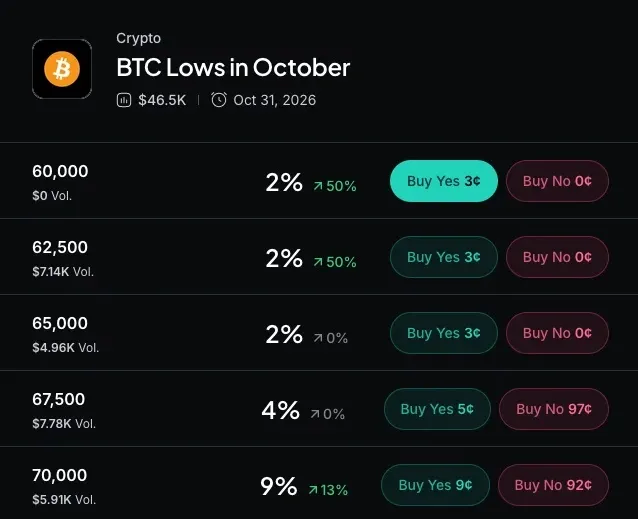
Myriad: How low will Bitcoin go? Click to make your prediction.
In general, the market is bouncing today after spending most of the week heading in the other direction.
Thursday's drop triggered $948 million in liquidations, 90.6% of them longs, per CoinGlass data. A liquidation is the forced closing of a trade placed with borrowed money after losses wipe out the collateral, and a long is a bet on rising prices, so the selling feeds on itself.
On the daily chart, Bitcoin hugs an important resistance market of $81,603, a level traders draw between a major low and high to estimate where pullbacks find buyers. Thursday's wick to $79,711 dipped under it and under the 50-day exponential moving average, or EMA, a line weighting recent prices more heavily, now at $80,407.
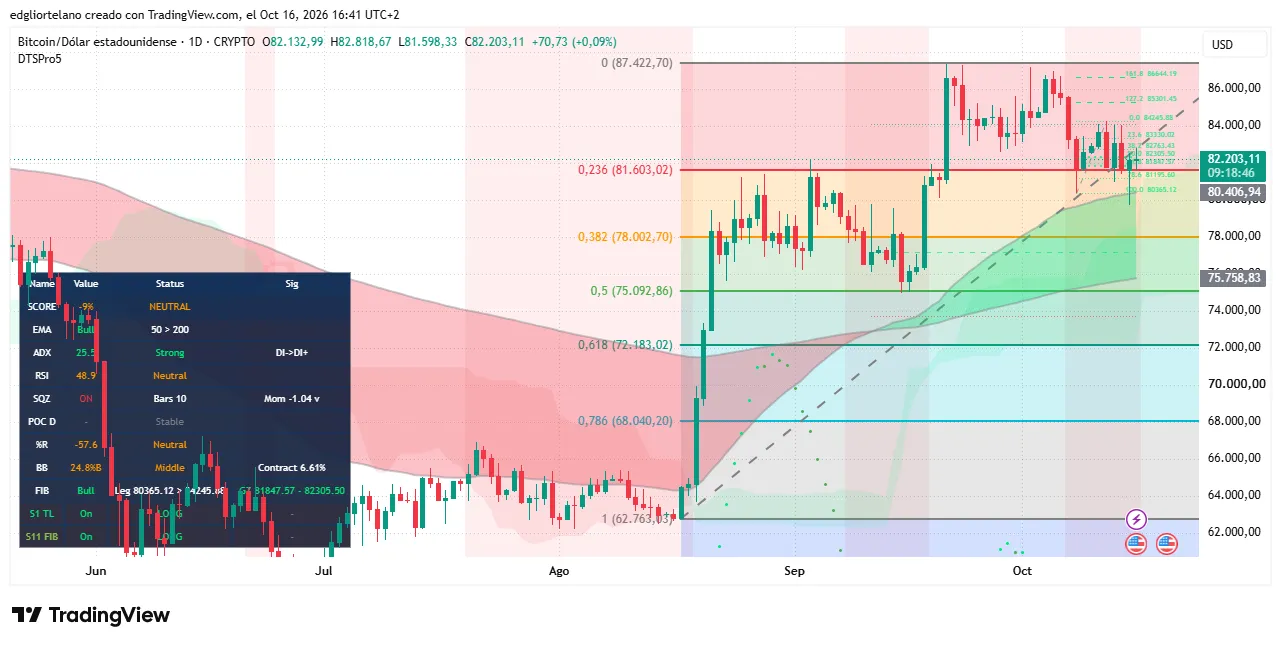
Bitcoin price data. Image: Tradingview
The 200-day EMA sits at $75,759, about 8% below the current price, and with the 50-day above it, the long-term trend still reads bullish.
The Average Directional Index, or ADX, which measures trend strength without direction, reads 25.5, barely above the 25 line that confirms a trend, and sellers (DI-) lead buyers (DI+). The Relative Strength Index, or RSI, is a 0-to-100 momentum gauge where 70 is overbought and 30 oversold. Thats at 48.9, neutral with a slight lean to sellers.

BitcoinBTC · USD
$81,461−1.55%
24H7D1M1YYTD
Oct 9Oct 11Oct 13Oct 14Oct 16
$84.2k$82.9k$81.5k$80.2k
24h HighHigh$82,816
24h LowLow$81,634
VolVol$1.2B
Market projectionsOdds by Myriad
This week$80,000 to $82,000$80k–$82k56% chance

→
Buy Bitcoin with USDT
Powered by Jupiter
$50$100$500
Buy
Price data by CoinGeckoCoinGeckoMore Bitcoin news and projections →
On Myriad, the prediction market built by Decrypt's parent company Dastan, traders are placing odds at 31% that Bitcoin hits a high of $87,500 in October down from 45% on Tuesday. In a separate market, Myriad traders say there's now a 43% chance BTC falls to $77,500.
The bullish scenario needs buyers to defend $81,603 and close above $84,246, opening $85,301, $86,644 and the $87,423 high, ideally with a rising ADX as confirmation.
The sideways scenario keeps Bitcoin between the $80,365 swing low and $84,246. The bearish scenario starts with a daily close below $81,603, putting $80,407 and $80,365 in play, then $78,003 and the $75,759 to $75,093 zone where the 200-day EMA meets the 50% retracement.
Disclaimer
The views and opinions expressed by the author are for informational purposes only and do not constitute financial, investment, or other advice.
Daily Debrief Newsletter
Start every day with the top news stories right now, plus original features, a podcast, videos and more.
Email addressJoin free
Join 72,000+ readers
Create an account to save your articles.
Add on Google
Add Decrypt as your preferred source to see more of our stories on Google.