




Bitcoin price fell below its 200-day moving average of $73,137 on Thursday. It‘s one of the most closely watched indicators in crypto because it helps investors understand whether Bitcoin’s long-term price trend is strengthening or weakening.
BTC currently trades at around $71,000, nearly 3% below that critical level. If Bitcoin fails to reclaim that level, the largest cryptocurrency could fall towards $67,000, erasing all of its gains since August.
Sponsored

Sponsored
Fed Almost Certain to Hike Interest Rates
The market now widely expects an interest rate hike in December from the Federal Reserve. The latest CPI data suggested inflation is hotter than expected, which leaves no room for a rate pause.
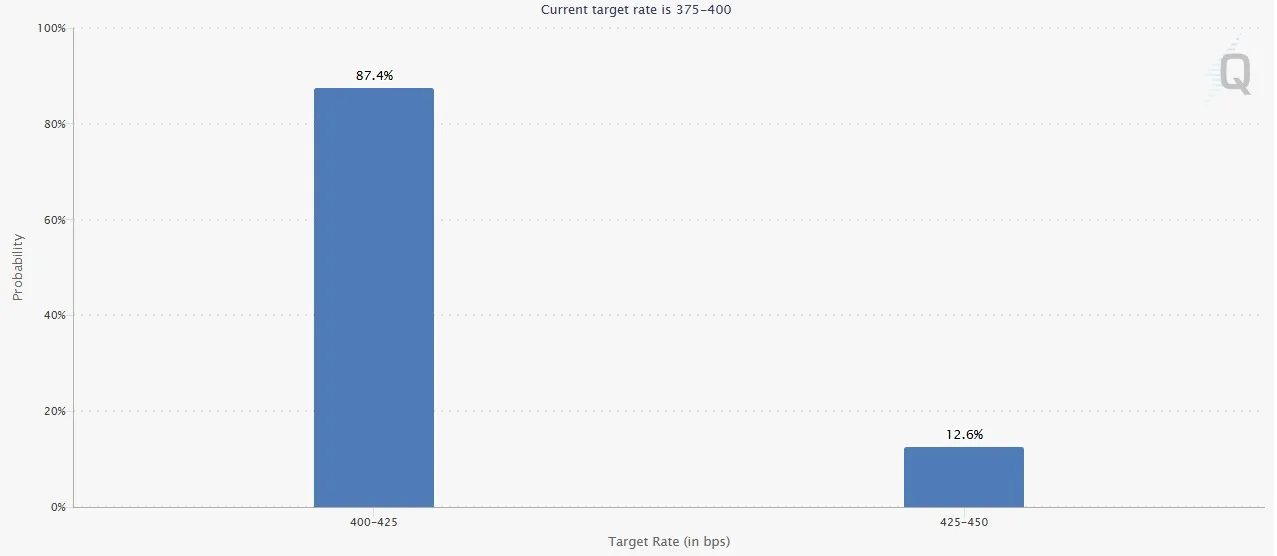
CME FedWatch December rate hike probabilities. Source: CME FedWatch
Meanwhile, the 10-year Treasury yield returned to roughly 5%, and the dollar index neared a 19-month high, per Kitco.
Gold and Silver also fell by more than 2%.
Are Bitcoin Holders Selling?
US spot Bitcoin ETFs lost $299.8 million on Wednesday, extending five days of outflows. BlackRocks IBIT accounted for most of the exit.
Separately, index provider MSCI confirmed it will remove Strategy (MSTR), the Bitcoin treasury firm, from two US indexes.
Sponsored
Sponsored
Spot selling then accelerated once BTC lost $72,000, analyst Ted Pillows noted.
Whats Next For Bitcoin Price?
Bitcoin is on track to close below its 200-day moving average, a key indicator investors use to judge the markets long-term direction. Falling below it suggests the market is weakening and further losses are possible.
If selling continues, Bitcoin could fall toward $68,000, followed by $67,000. To regain momentum, BTC first needs to recover above its 200-day average. The next major obstacle is $75,000.
There is some hope for buyers. Bitcoins Relative Strength Index (RSI), which measures buying and selling momentum, has fallen to 30. This suggests Bitcoin may be oversold and due for a rebound.
A similar reading on June 30 marked a market bottom. However, earlier in June, Bitcoin continued falling despite showing the same warning signs.
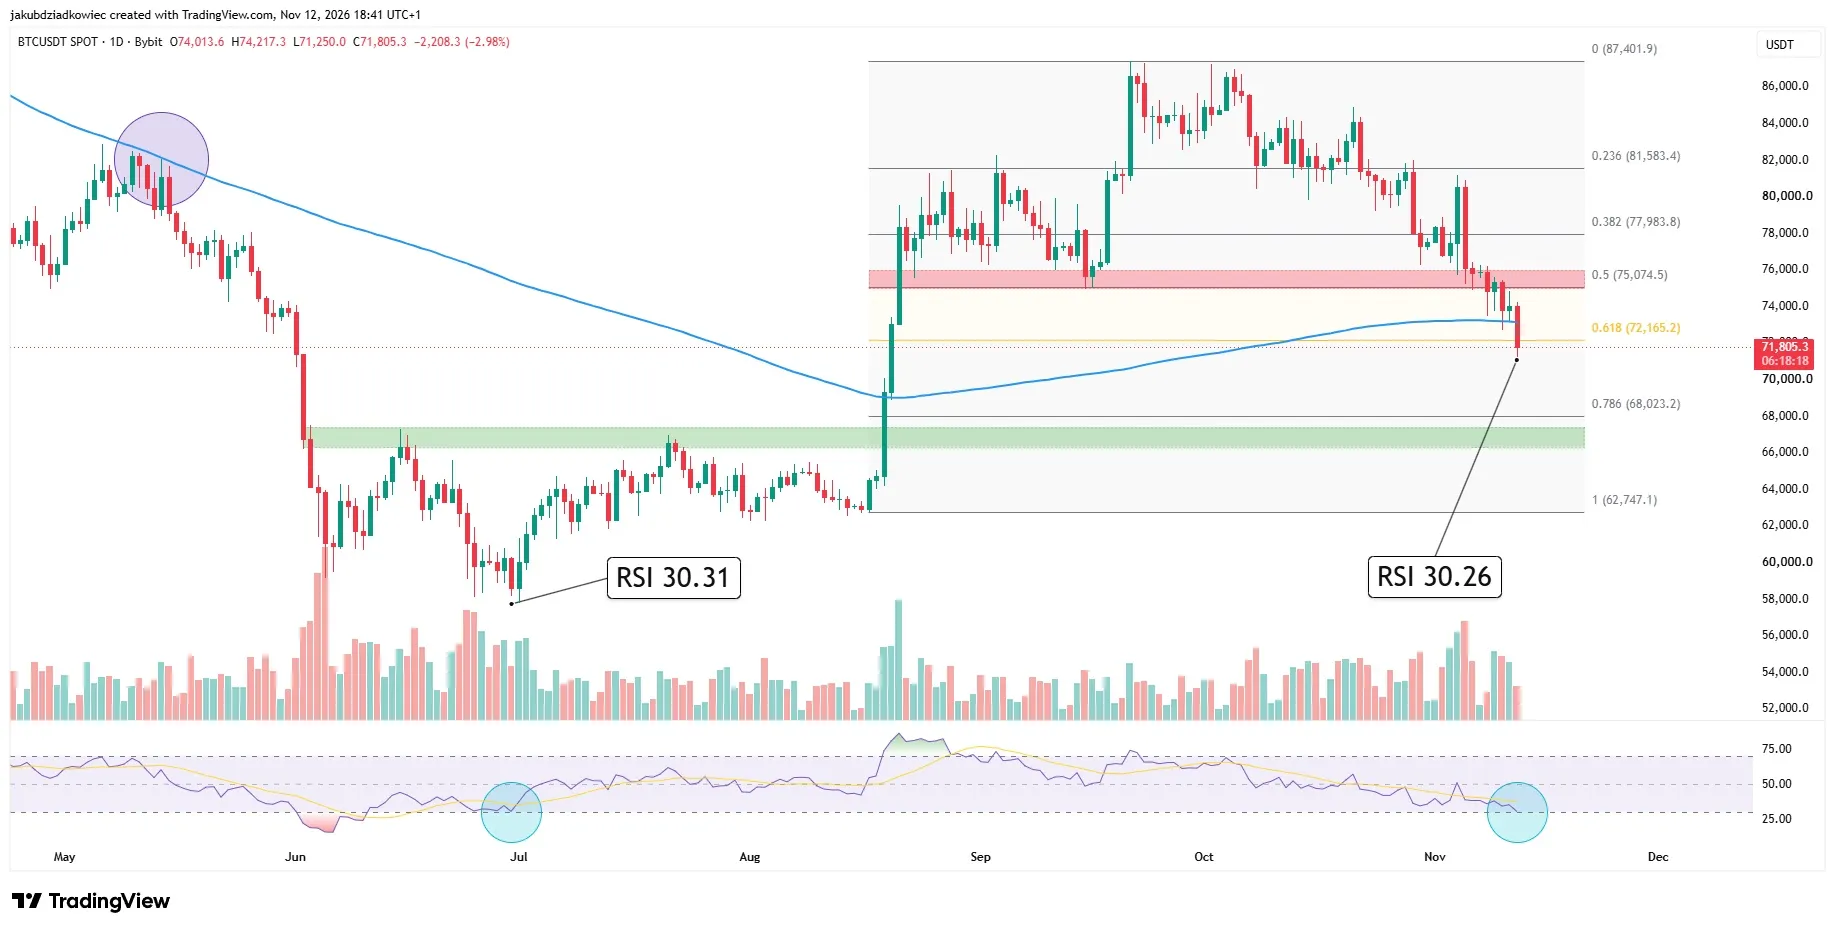
BTC daily chart. Source: TradingView
Analysts takeaway: Bitcoin is showing signs of weakness, but a short-term recovery remains possible. The $67,000–$68,000 range is the next key area to watch if prices keep falling.