





Goatseus Maximus (GOAT) price has surged 34.19% over the past seven days, recently reaching a $1 billion market cap milestone. However, technical indicators suggest the uptrend is losing strength, with the ADX and RSI pointing to fading momentum.
While the EMA lines remain bullish, short-term trends are beginning to decline, signaling a potential shift in market sentiment. GOAT now sits at a critical point where it could either test resistance at $1.36 or face a deeper correction toward key support zones.
The Current Trend Is Losing Steam
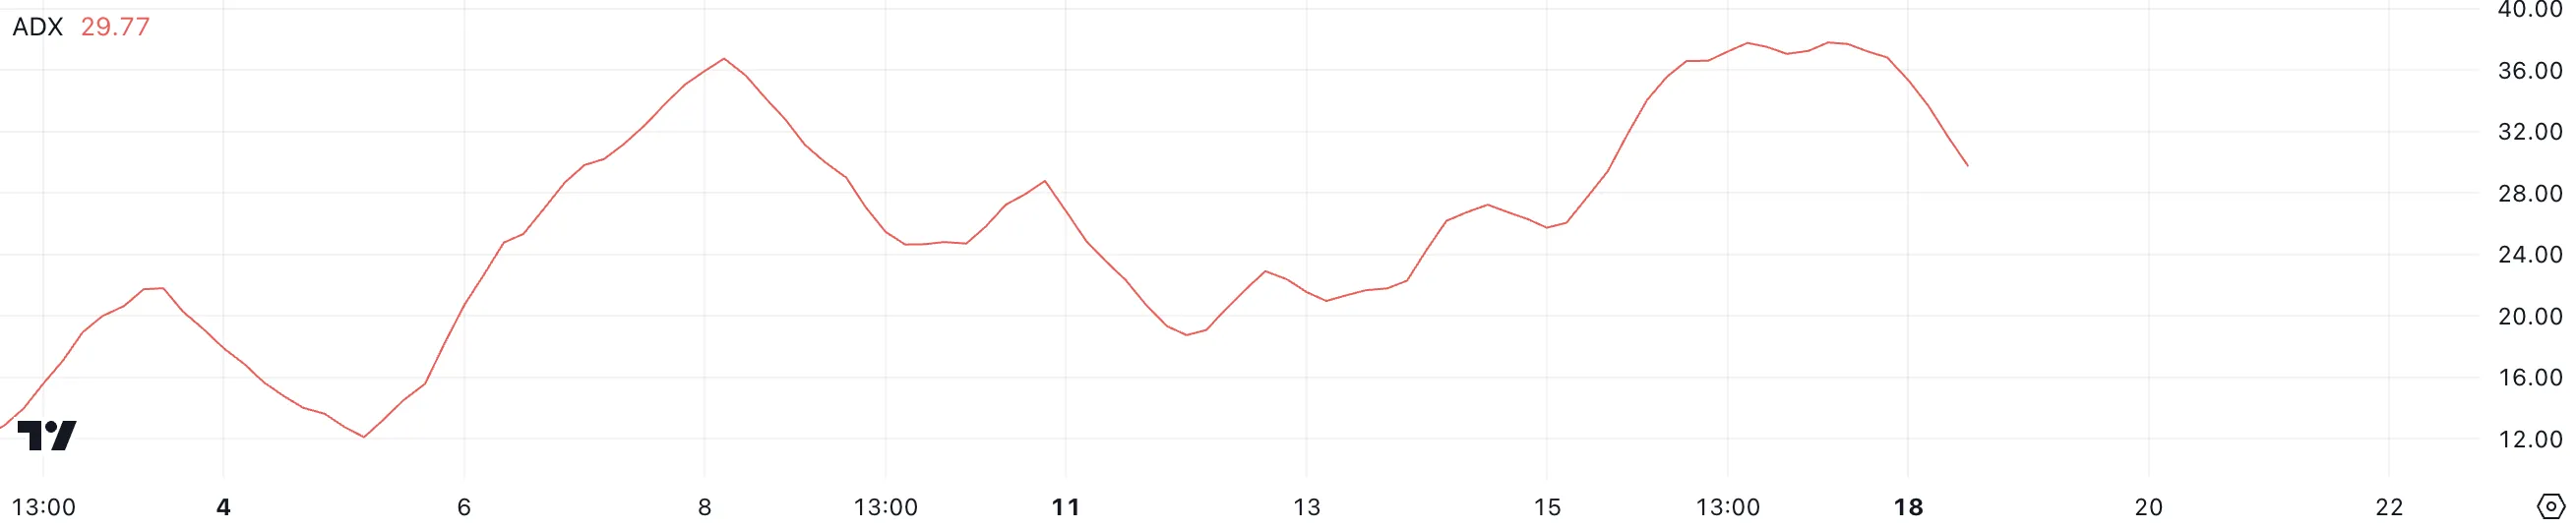
GOAT ADX has dropped to 29.77 from 38 over the past few days, indicating a weakening in trend strength. While the value still suggests that the asset is in an uptrend, the decline shows that the momentum behind the current trend is fading.
GOAT ADX. Source: TradingView
The ADX, or Average Directional Index, measures the strength of a trend on a scale from 0 to 100. Values above 25 indicate a strong trend, while values below 20 suggest a weak or directionless market.
With GOATs ADX now falling closer to the lower threshold, it suggests the current uptrend is losing steam. If the ADX continues to decline further, traders should watch for signs of a potential downtrend or a sideways movement as the market adjusts.
GOAT RSI Shows a Neutral Zone
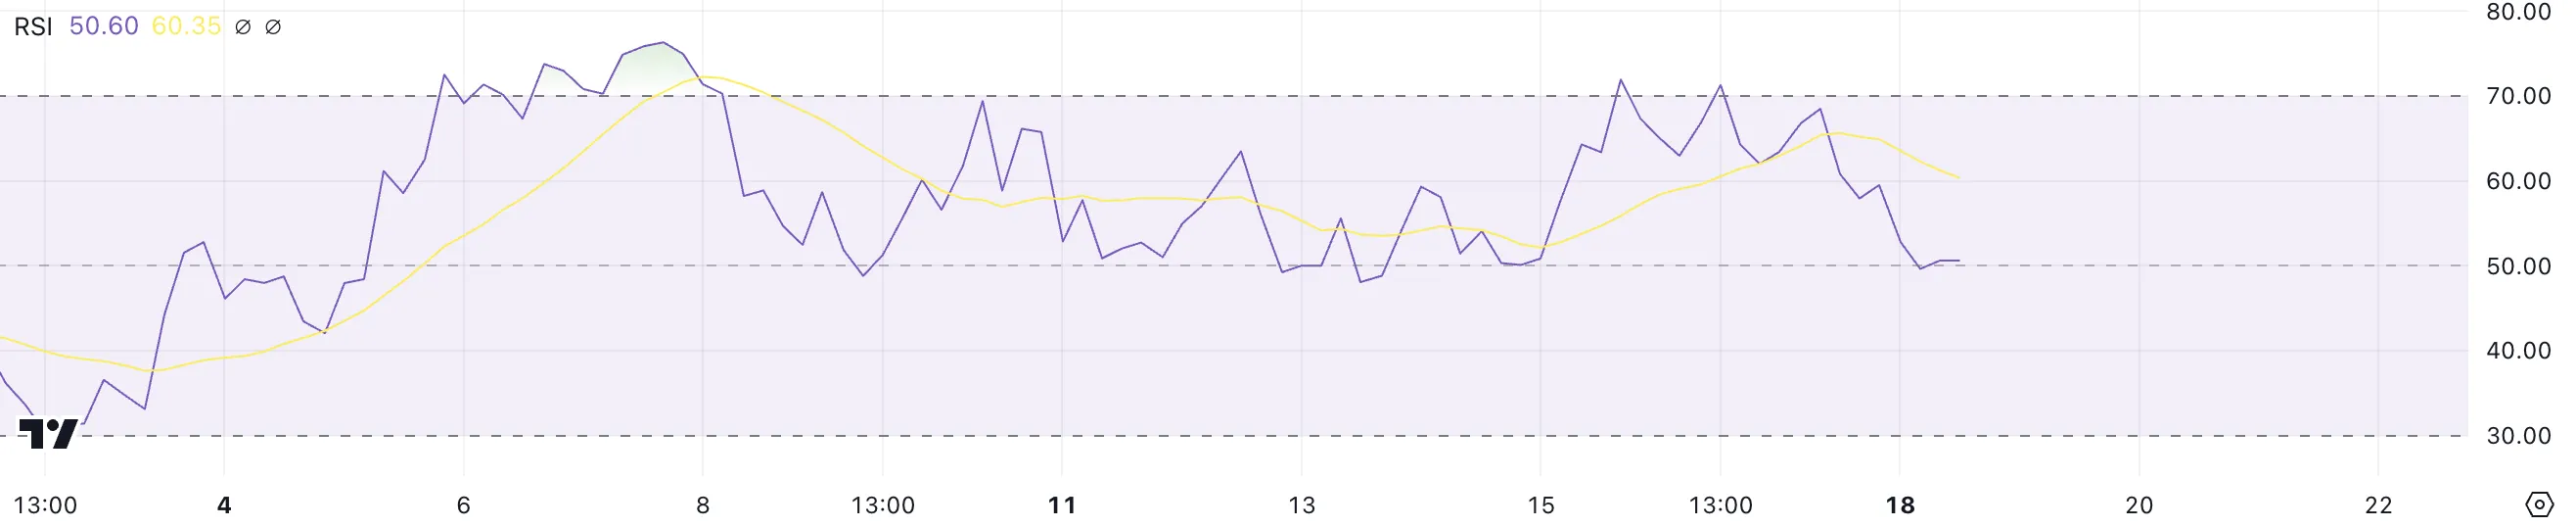
GOAT is today the biggest coin ever launched on Pumpfun, Solana‘s biggest coin launchpad. GOAT’s RSI has dropped to 50.60 from over 70 a few days ago, reflecting a cooling off in bullish momentum. Previously in the overbought territory above 70, the asset was experiencing strong upward pressure.
However, the decline to neutral levels indicates a slowdown in buying activity, suggesting that the recent rally has lost strength and the market is recalibrating.
GOAT RSI. Source: TradingView.
The RSI, or Relative Strength Index, measures the speed and magnitude of price changes to assess whether an asset is overbought or oversold. Values above 70 indicate overbought conditions and potential for a pullback, while values below 30 signal oversold conditions and possible recovery.
With GOATs RSI now at 50.60, it sits at a neutral level, meaning the price lacks strong momentum in either direction.
GOAT Price Prediction: Potential 63% Correction
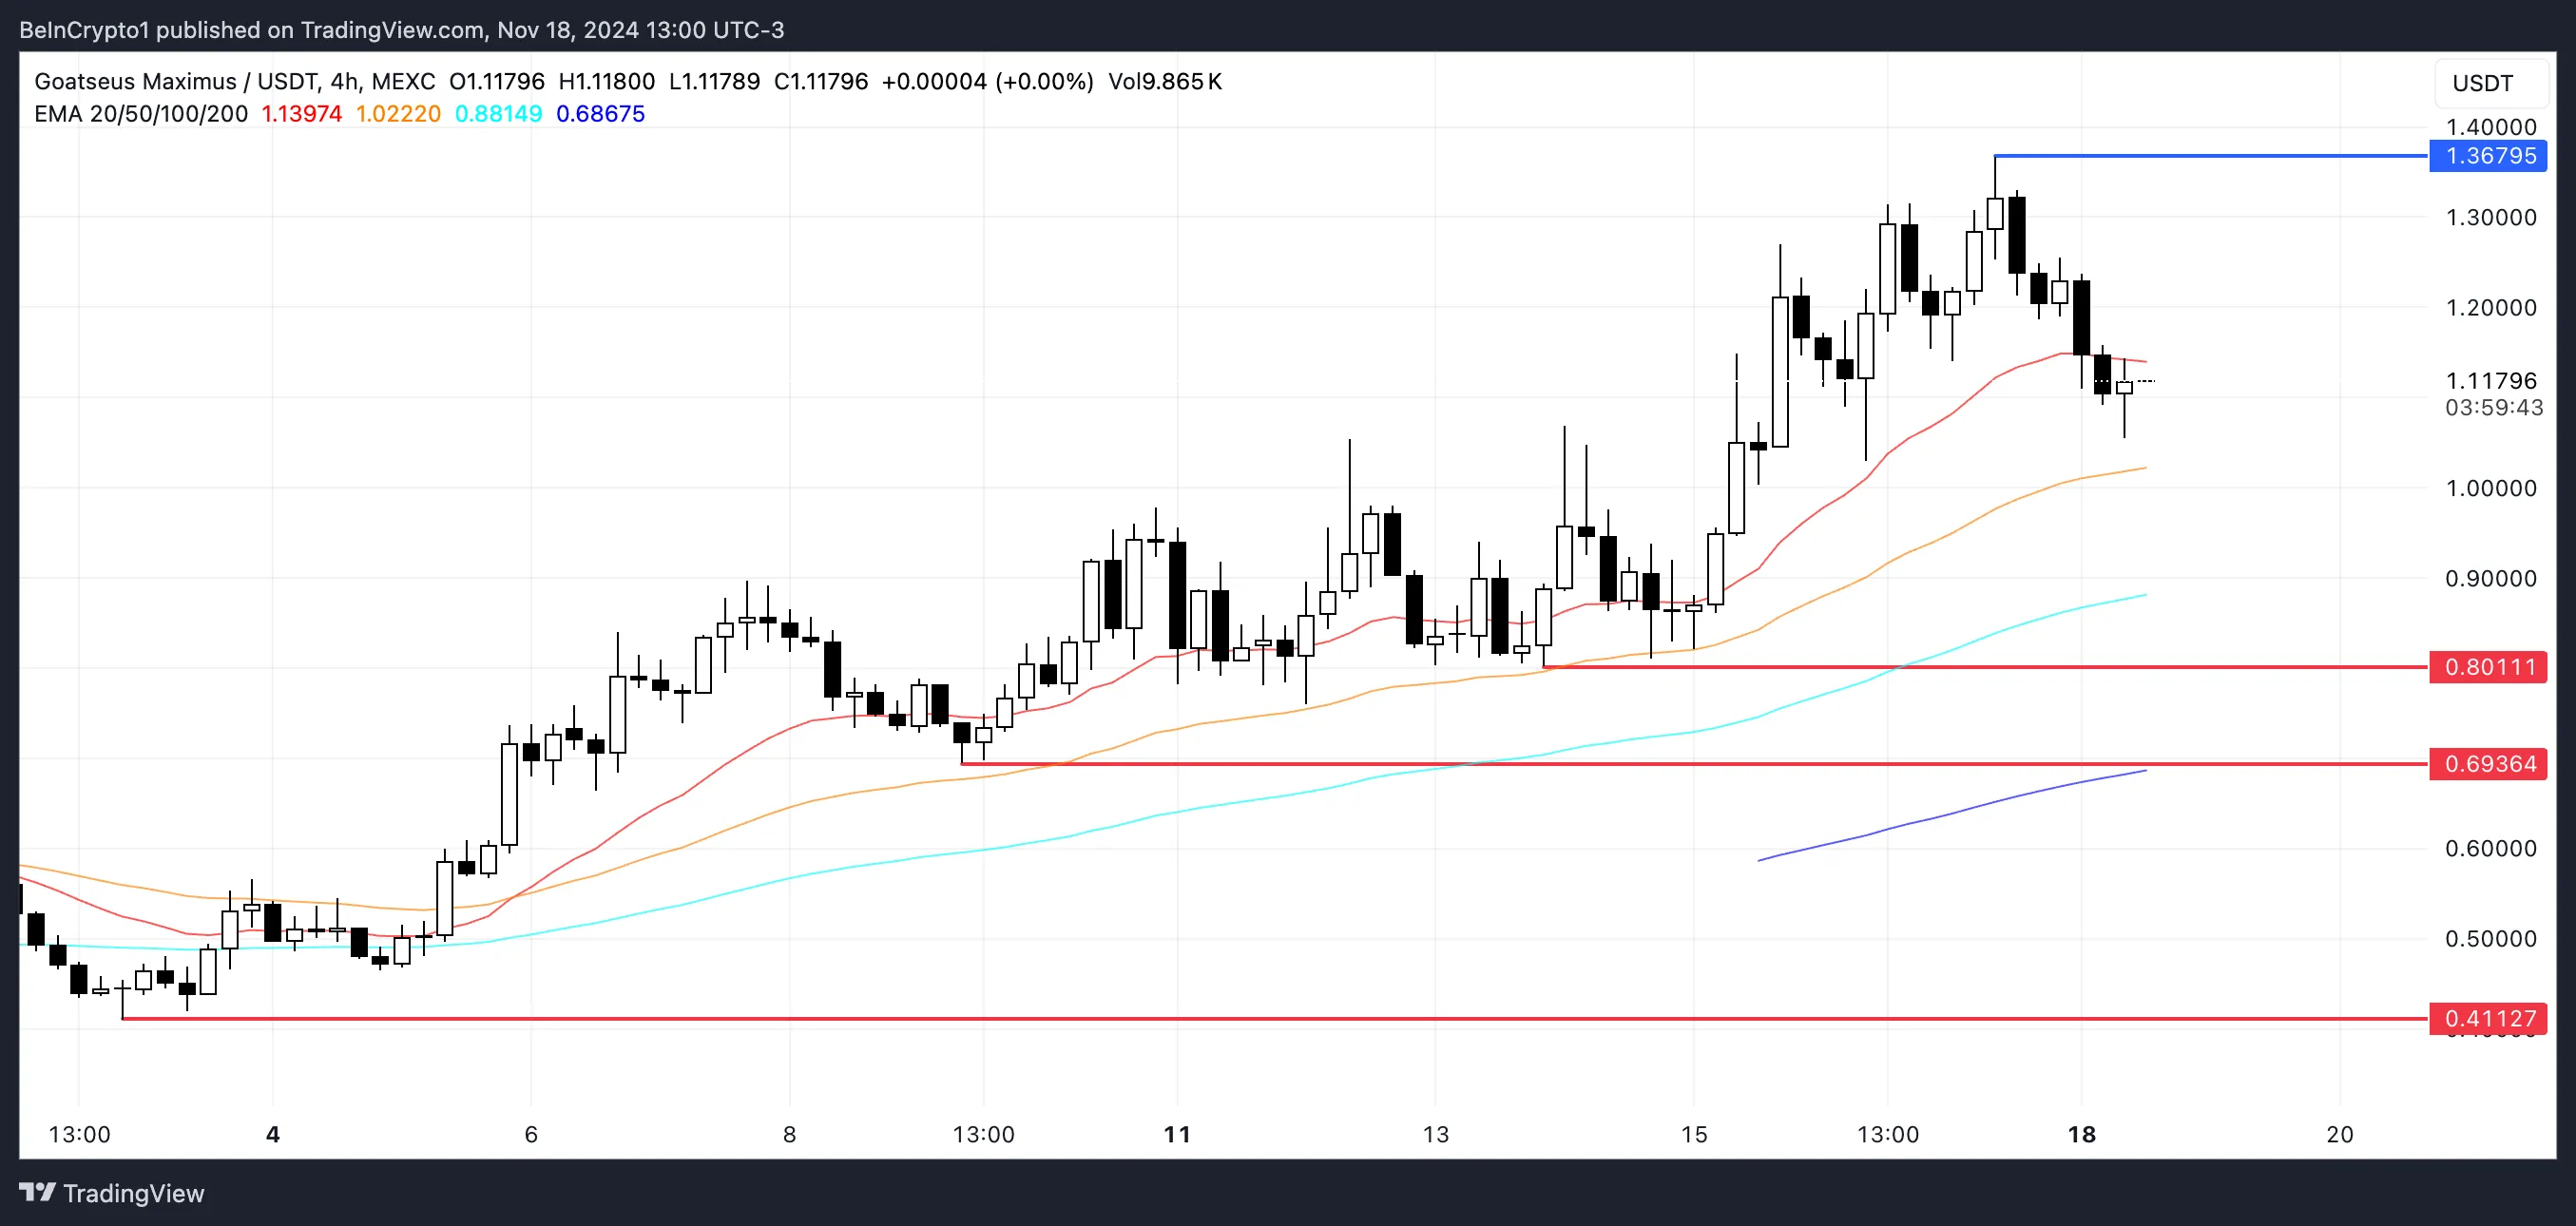
GOATs EMA lines remain bullish, but the short-term lines are beginning to decline, signaling weakening momentum in the uptrend. This aligns with the RSI and ADX, both of which suggest that the bullish trend is losing strength.
GOAT Price Analysis. Source: TradingView
If the uptrend regains momentum, GOAT price could target its resistance at $1.36, signaling potential for further gains. However, if the downward pressure intensifies, support levels could be tested at $0.80 and $0.69.
A failure to hold these zones might lead to a deeper correction, potentially reaching $0.41, which would mark a significant 63% decline from current levels, possibly taking out GOAT from the list of top 10 biggest meme coins.