




Bitcoin (BTC), Ethereum (ETH), and Ripple (XRP) are all in the green following improved sentiment in the broader cryptocurrency market.
The rally by the leading cryptocurrencies positively affected other top altcoins, with Cosmos Hub ($ATOM) becoming one of the best performers among the top 100 cryptocurrencies by market cap.
$ATOM extended its gains, trading at $1.90 on Wednesday, rallying nearly 8% so far this week.
Its rally is fueled by improved derivatives metrics, with the constructive technical outlook suggesting further upside potential for $ATOM in the near term.
Derivatives data suggests a bullish bias
$ATOM is one of the best performers in the market thanks to growing retail demand.
CoinGlass Open Interest (OI) for $ATOM surges to $137.25 million on Wednesday, up from $125 million on April 15.
The OI has been rising steadily over the past seven days. An increasing OI indicates new or additional money entering the market and new buying, which could fuel a rally in the $ATOM price.
Furthermore, $ATOMs funding rates show a bullish bias.
$ATOMs funding rates flipped positive on Monday and rose to 0.0093% on Wednesday, indicating that the longs are paying the shorts.
Usually, when rates have turned positive and risen, the Cosmos Hub price has recorded significant gains within a short period.
Cosmos Hub price forecast
While other leading cryptocurrencies are yet to break out of their bearish structure, the $ATOM/USD 4-hour chart has already turned bullish.
$ATOM is trading at $1.91, above the 50-day Exponential Moving Average (EMA) at $1.82.
However, it remains well below the 100- and 200-day EMAs at $1.98 and $2.44.
The altcoin is attempting to build a base after reclaiming nearby dynamic support, while the long-standing downward-sloping trendline, around $1.93, continues to define the immediate topside cap.
The momentum indicators suggest that the bulls could push $ATOMs price higher in the near term.
The Relative Strength Index (RSI) on the 4-hour chart is near 69, indicating a strong bullish bias.
The expanding Moving Average Convergence Divergence (MACD) histogram hints that upside momentum is improving.
However, these signals only soften, rather than reverse, the prevailing medium-term bearish backdrop set by the higher EMAs.
If the rally persists, the bulls would meet initial resistance at the descending trendline break area near $1.93, with the 4-hour swing high of $2.036 also a major level.
A daily close above this level could expose the 38.2% retracement at $2.39 before the bulls attempt to take on the 200-day EMA at $2.44.
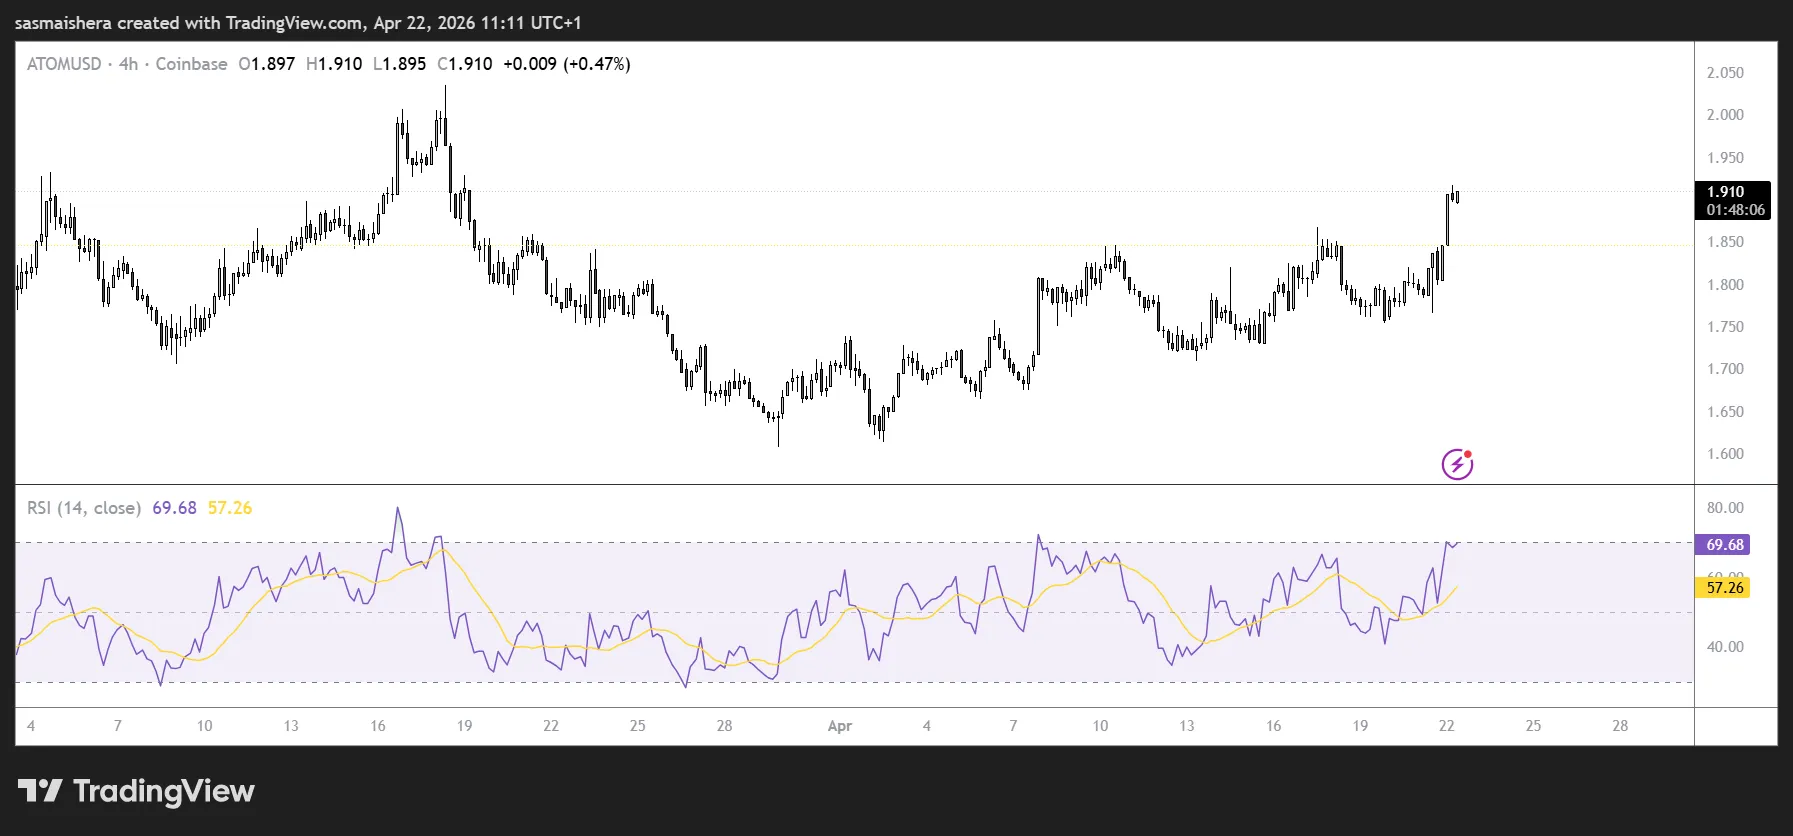
However, if the bears regain control, immediate support is visible at the 50-day EMA of $1.82.
A break below these levels would expose the next floors at $1.65 and the cycle low area near $1.60, where bearish pressure could begin to exhaust.
The ongoing tension in the Middle East continues to affect the broader crypto market.
However, with the extension of the ceasefire, $ATOM and other major coins could rally higher in the near term.