






Netflix stock fell to $64.10 on Wednesday, its lowest level since August 2024. The streamer beat profit estimates, yet a weaker fourth-quarter outlook sent investors heading for the exit.
The slide leaves shares roughly 50% below their mid-2025 record of $134.12. Yet Netflixs trailing 12-month revenue has never been higher.
Sponsored

Sponsored
Netflix Stock Beat on Profit, So Why Are Investors Selling?
Third-quarter earnings per share (EPS) came in at $0.87, above the $0.82 analysts expected, according to Reuters. Revenue grew 12% to $12.87 billion, matching forecasts.
However, guidance did the damage. Netflix projected fourth-quarter EPS of $0.67, short of the $0.73 consensus.
The company also lowered its 2026 advertising revenue target to about $2.7 billion from $3 billion. Its shareholder letter blamed a slower rollout of ad features.
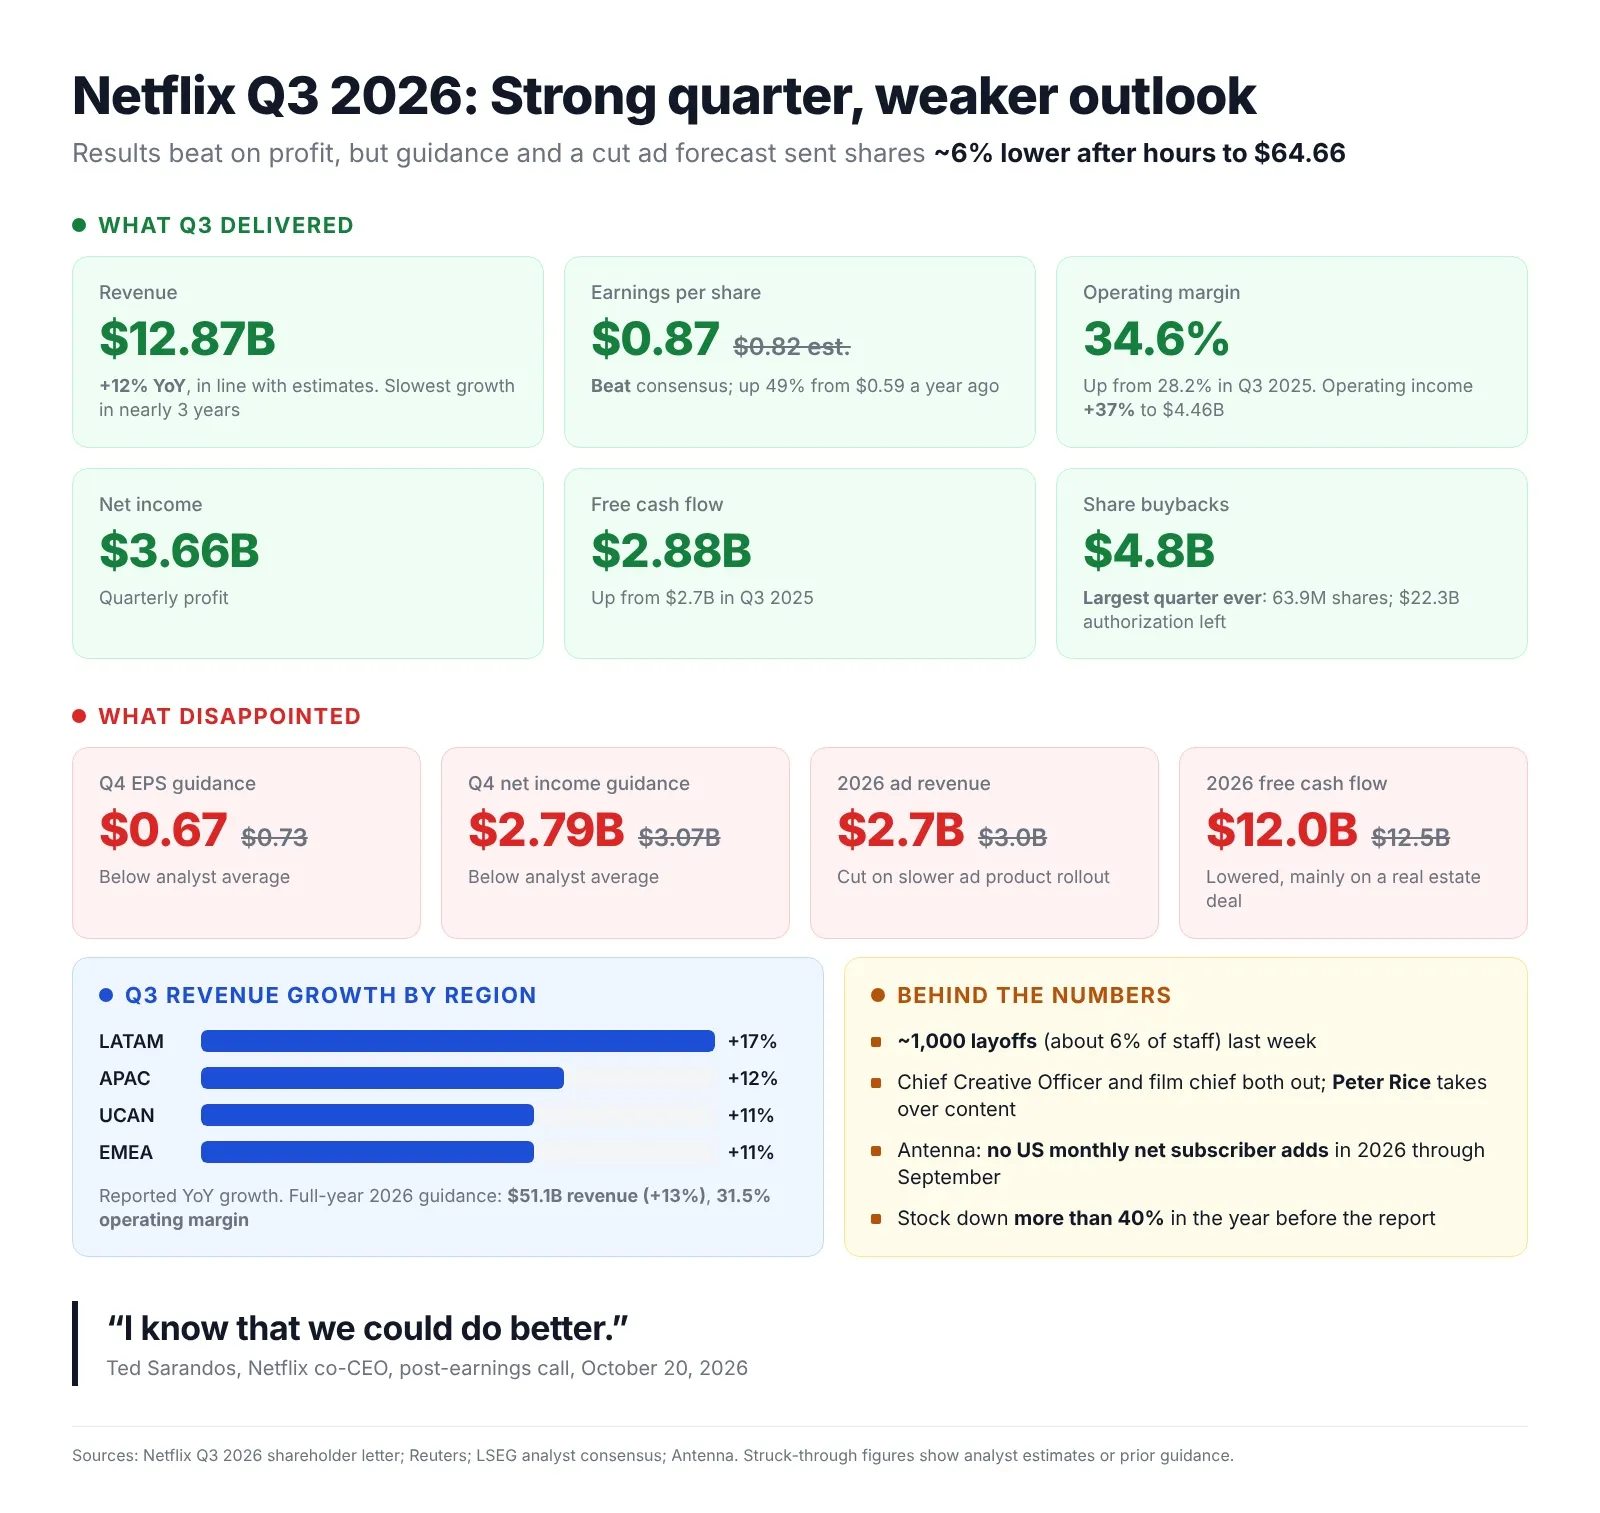
The report capped a turbulent week. Netflix cut roughly 1,000 jobs and replaced both its chief creative officer and its film chief.
“I know that we could do better.”
Ted Sarandos, co-CEO of Netflix, made the admission on the post-earnings call. He added that the strategy needs no fundamental shift, only better execution in the US.
Sponsored
Sponsored
The full breakdown of results and guidance appears in the infographic below.
Is Anyone Still Watching Netflix?
Revenue data paint a different picture than the share price.
Netflixs trailing 12-month revenue reached about $50 billion in September. That equals a 20.4% compound annual growth rate since 2015.
Historically, the last stall came between early 2022 and mid-2023. Growth then resumed, and operating margin has since widened to 34.6% from 28.2% a year earlier.
Still, US demand remains an open question. Antenna, a subscription analytics firm, recorded no monthly US net subscriber gains in 2026 through September.
Netflix disputed that data. The company said global and US churn improved year-over-year.
Can Netflix Stock Hold Its 2021 Record High?
On the monthly chart, NFLX is retesting its 2021 all-time high zone between roughly $65 and $70.
A monthly close below it would expose the 0.618 Fibonacci retracement at $61.29. The next major support sits near $41.50.
Meanwhile, resistance stands at $75.20, followed by $89.10. The monthly Relative Strength Index (RSI) has slipped to about 40.
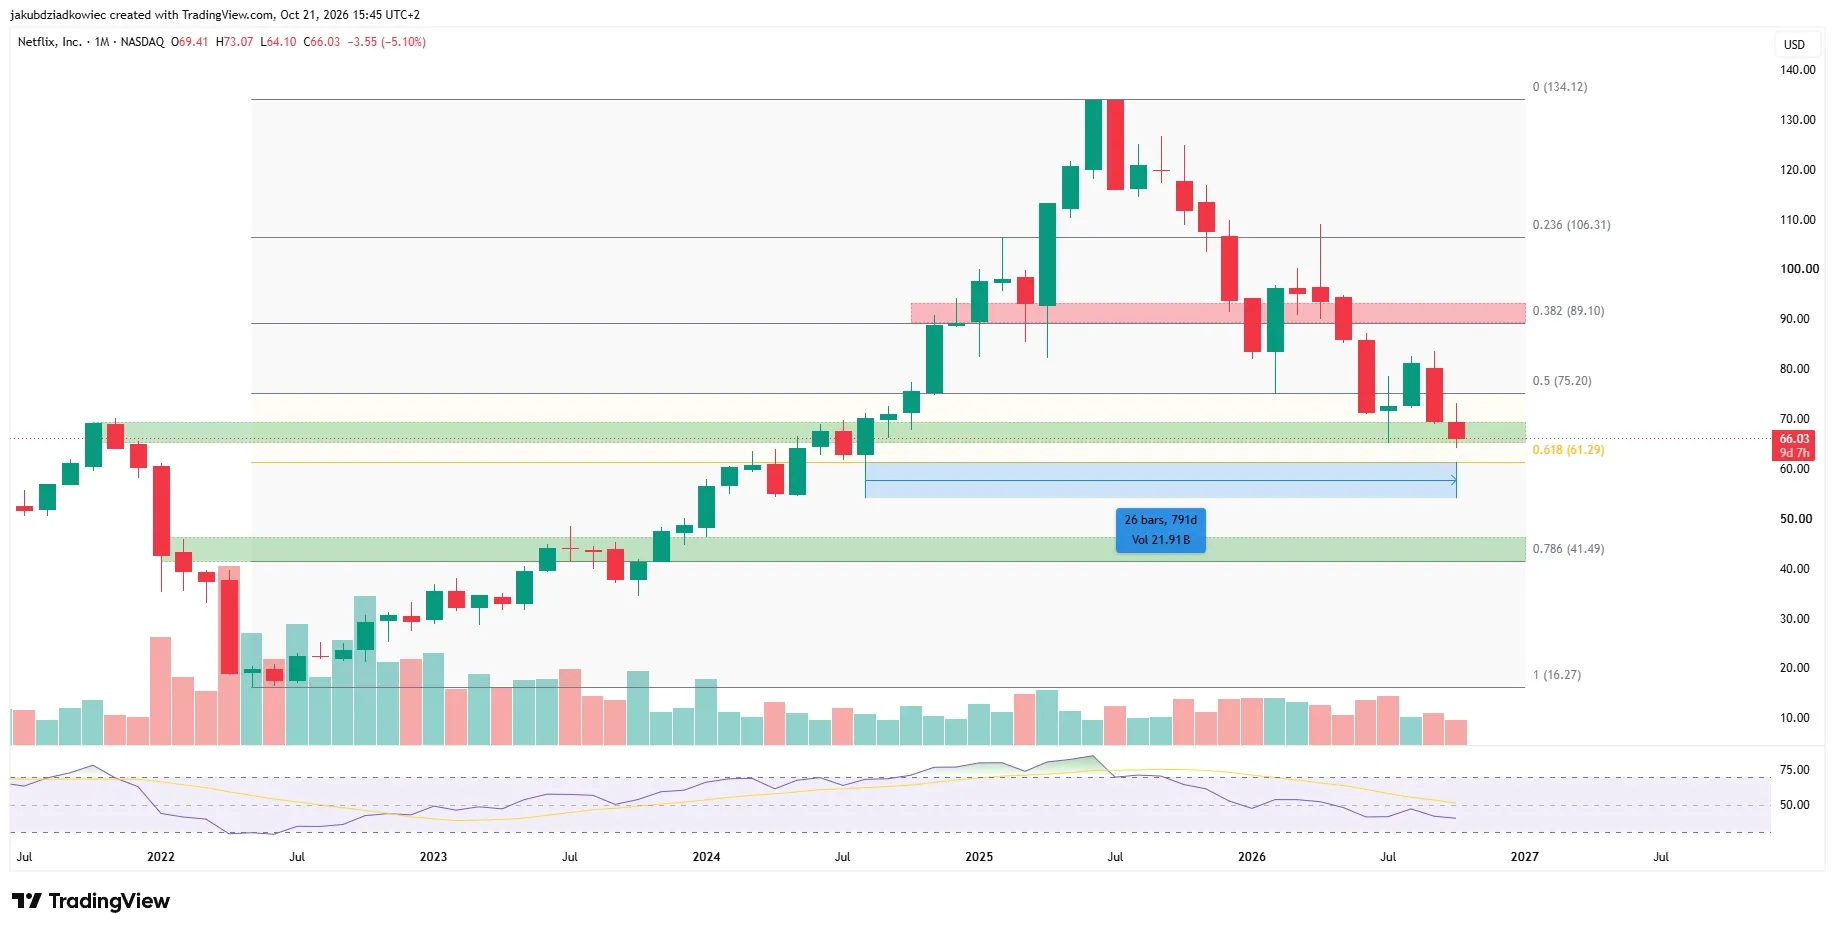
NFLX monthly chart. Source: TradingView
The daily chart shows a descending parallel channel in place since April 16. Its midline converges with the $61 Fibonacci level.
Wednesdays low undercut the July 17 bottom. In addition, daily RSI near 36 signals firm bearish momentum, though not yet oversold.
Buyers did step in early. At the time of writing, NFLX traded at $66.39, down 3.35% on the day, per TradingView.
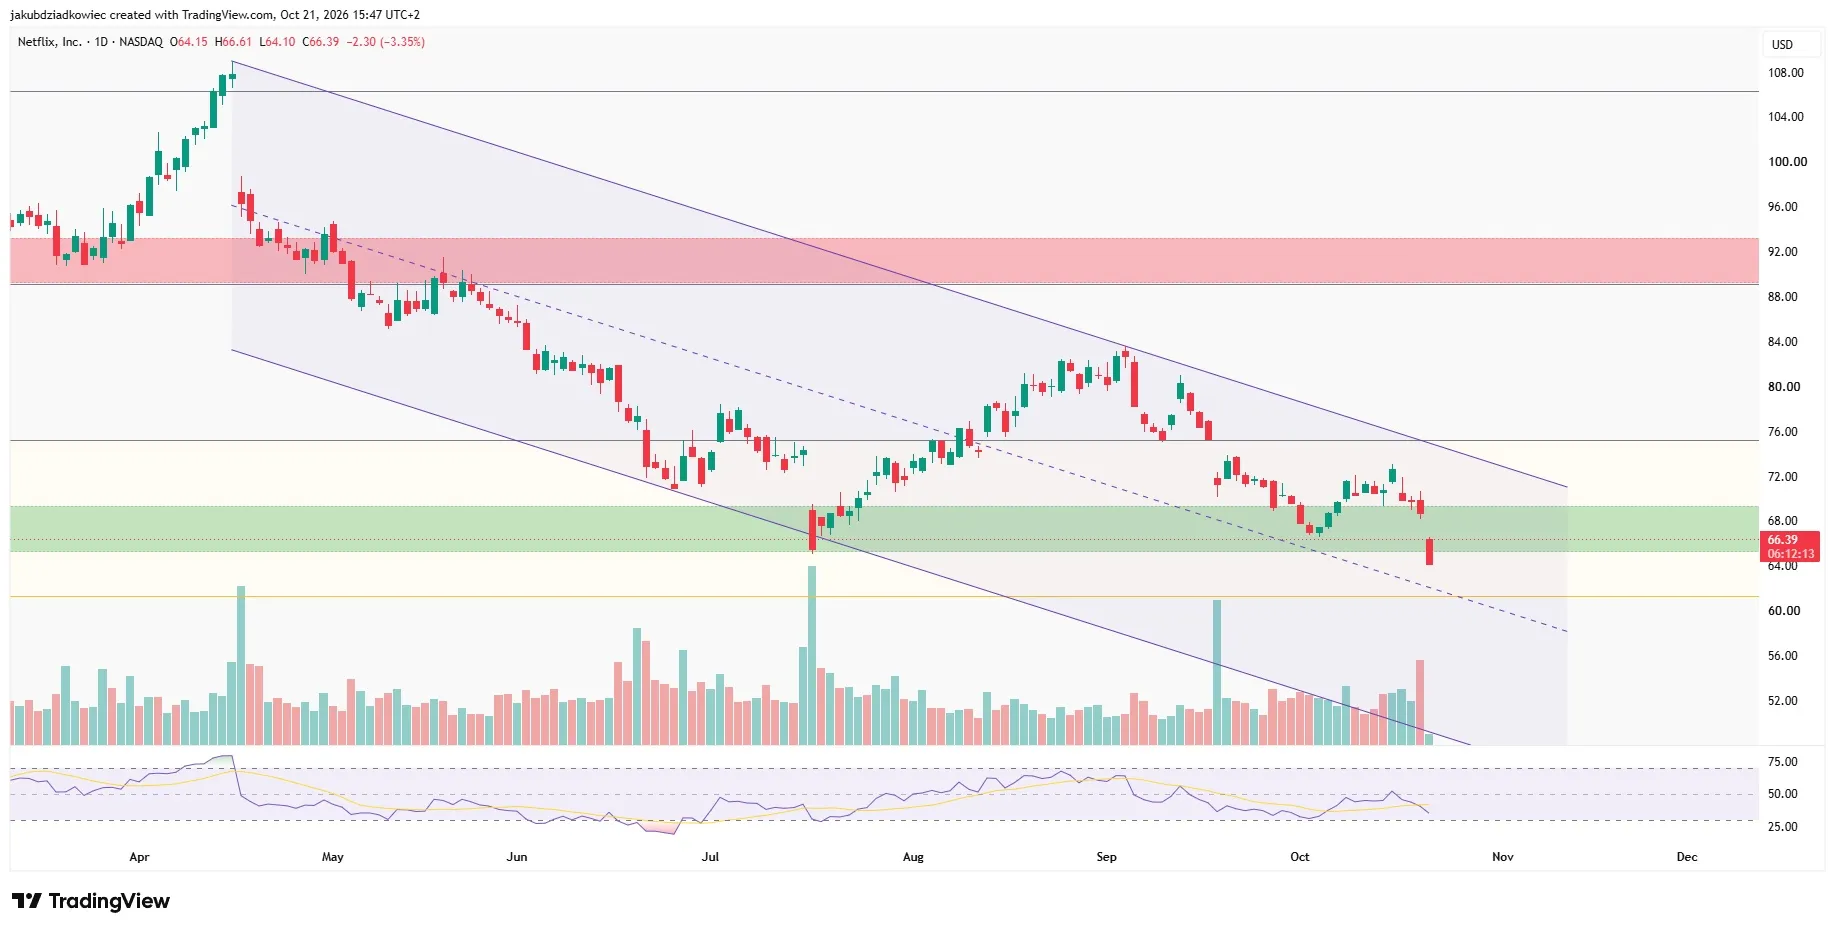
NFLX daily chart. Source: TradingView
Netflix now sits between two narratives. Profits and revenue keep climbing, while YouTube and TikTok compete harder for viewing time. Whether the 2021 high holds may reveal which story investors trust more.