






Chip stocks have closed lower for eight straight sessions, their longest losing streak in 16 years, according to Barchart. The iShares Semiconductor ETF (SOXX) closed Thursday at $514.71, nearly 14% off its October high.
Thursday also brought the first sign of resistance. SOXX briefly slipped under $496, then clawed back to close above its open on the heaviest volume in months.
Sponsored

Sponsored
What Exactly Are Investors Selling?
SOXX is a $44.7 billion BlackRock fund that tracks the ICE Semiconductor Index, a basket of about 30 US-listed chipmakers. Its 10 largest positions account for roughly 62% of assets.
| Company | Ticker | Weight |
|---|---|---|
| Advanced Micro Devices | AMD | 9.47% |
| Intel | INTC | 8.56% |
| Nvidia | NVDA | 7.83% |
| Micron Technology | MU | 7.45% |
| Broadcom | AVGO | 7.30% |
| Marvell Technology | MRVL | 4.53% |
| Analog Devices | ADI | 4.35% |
| Texas Instruments | TXN | 4.20% |
| KLA | KLAC | 3.98% |
| Qualcomm | QCOM | 3.95% |
SOXX top 10 holdings as of October 15, 2026, per iShares
The biggest names took the heaviest hits. Intel has lost more than 20% in two weeks, while AMD dropped over 5% intraday on October 14.
Why Are Investors Dumping the AI Booms Favorite Chip Stocks?
- AI spending doubts.OpenAI reportedly told investors its annualized revenue neared $50 billion, short of earlier $70 billion estimates. Broadcom CEO Hock Tan has also described some AI investors as gamblers.
- Inflation and rate hikes.September consumer prices rose 3.7% year over year, topping forecasts. Traders now price a 92% chance of another Fed hike this year.
- Asian memory rout.Selling spread from Koreas chip-heavy KOSPI. Meanwhile, progress by Chinese memory maker ChangXin Memory Technologies (CXMT) fueled fears that China is catching up.
Sponsored
Sponsored
Demand, however, is not the problem. Taiwan Semiconductor Manufacturing Company (TSMC) reported a 68.7% jump in third-quarter profit, yet its US shares still fell 1.8%.
Can Buyers Defend the $500 Zone?
On the daily chart, SOXX trades below its 50-day moving average (MA), which capped rallies in August and September (red arrows). The Relative Strength Index (RSI), a momentum gauge, has fallen to 36, its lowest reading since July.
Thursdays volume spike suggests dip buyers are stepping in. If selling resumes, the 0.5 Fibonacci retracement near $481 is the next major support.
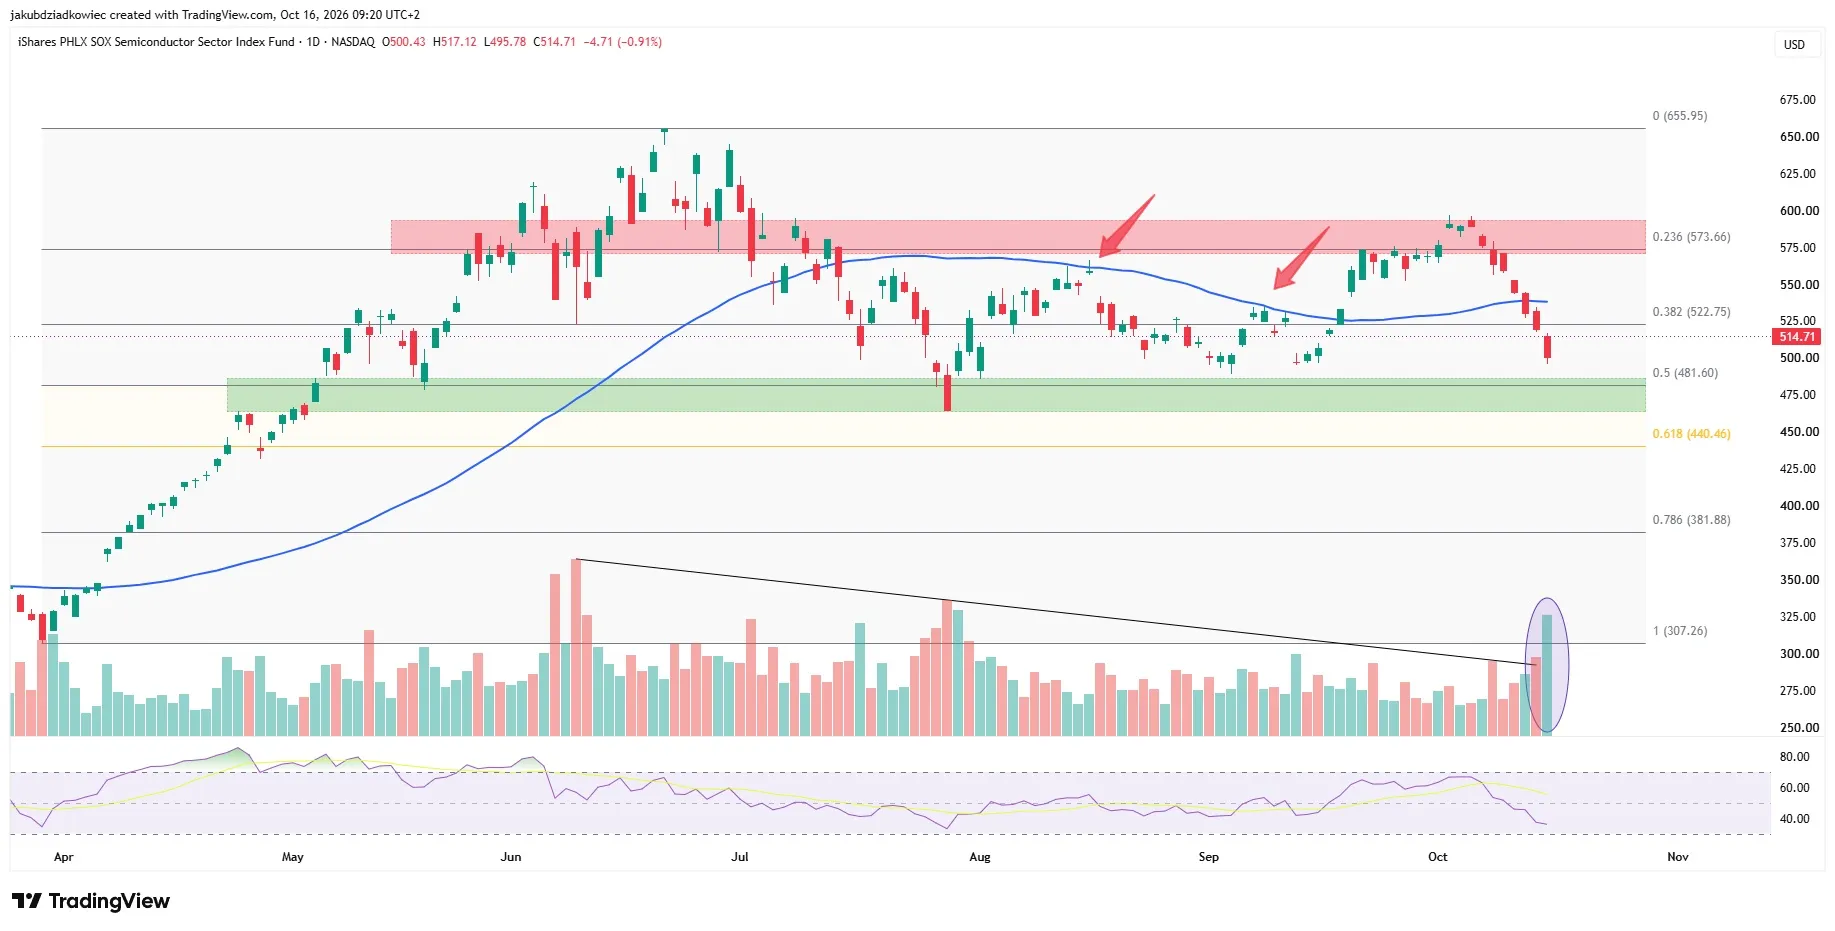
SOXX daily chart Source: Tradingview
Overhead, SOXX must reclaim $523 and the 50-day MA near $540. The bigger barrier sits at $573, the 0.236 Fibonacci level.
UBS reads the sell-off as a reset:
“More of a recalibration of expectations than a fundamental break in the AI investment story.”
JPMorgan strategists also flagged a possible inflection point. Yet Big Tech plans roughly $800 billion in capital spending this year, per Goldman Sachs. The next leg for chips may hinge on borrowing costs, not demand.