






Bitcoin gained bearish momentum and even declined below $40,000 against the US Dollar. BTC could recover if it manages to climb above the $40,000 pivot level.
Bitcoin remained in a bearish zone and extended decline below $40,000.
The price is now trading below $40,000 and the 100 hourly simple moving average.
There is a steep bearish trend line forming with resistance near $39,700 on the hourly chart of the BTC/USD pair (data feed from Kraken).
The pair could start a short-term recovery if there is a move above $40,000.
Bitcoin price struggled to recover above the $43,500 level. BTC started another decline and traded below the $42,000 support level.
The bears took control and pushed the price below the $41,000 level. There was also a clear move below the $40,000 support zone and a close below the 100 hourly simple moving average. The price traded as low as $39,240 and is currently consolidating losses.
An immediate resistance on the upside is near the $39,700 level. There is also a steep bearish trend line forming with resistance near $39,700 on the hourly chart of the BTC/USD pair.
The first major resistance is forming near the $40,000 level. The next resistance could be near $40,200. It is close to the 23.6% Fib retracement level of the recent decline from the $43,415 swing high from the $39,240 low. A clear move above the $40,000 and $40,200 levels might start a short-term recovery wave.
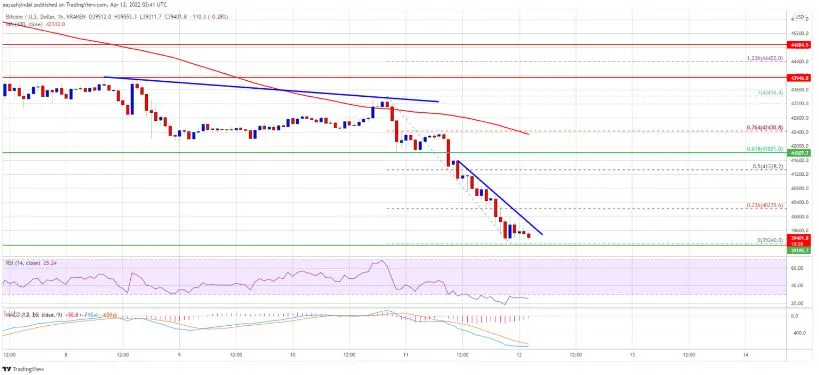
In the stated case, the price may perhaps rise towards the $41,350 resistance zone. It is near the 50% Fib retracement level of the recent decline from the $43,415 swing high from the $39,240 low.
More Losses in BTC?If bitcoin fails to clear the $40,000 resistance zone, it could continue to move down. An immediate support on the downside is near the $39,250 level.
The next major support is seen near the $38,880 level. A downside break below the $38,880 support zone could increase selling pressure. In the stated case, the price could accelerate lower towards the $37,500 level in the coming sessions.
Technical indicators:
Hourly MACD – The MACD is now gaining pace in the bearish zone.
Hourly RSI (Relative Strength Index) – The RSI for BTC/USD is now in the oversold zone.
Major Support Levels – $39,250, followed by $38,880.
Major Resistance Levels – $39,700, $40,000 and $40,200.