






The silver price fell 6.29% on Wednesday, October 14, to $55.74, its lowest daily close of 2026. Hot US inflation data revived Federal Reserve (Fed) rate-hike bets, and silver fell nearly six times harder than gold.
The intraday low of $55.39 left silver 54.5% below its January 29 record of $121.64. Yet Thursdays 2% rebound raises a sharper question. Is that discount a bargain or a value trap?
Sponsored
Sponsored
Why Did the Silver Price Fall Harder Than Gold?
Septembers Consumer Price Index (CPI) rose 3.7% year-on-year, above the 3.6% forecast, the Bureau of Labor Statistics reported. Gasoline alone jumped 9.1% in a month, as Brent crude held above $100.
The print briefly lifted the 10-year Treasury yield above 5.3%, according to Motilal Oswal analyst Manav Modi. Meanwhile, the dollar index (DXY) neared an 18-month high.
Consequently, CME FedWatch odds of a hike at the October 27–28 meeting briefly topped 50% before settling near one-third.
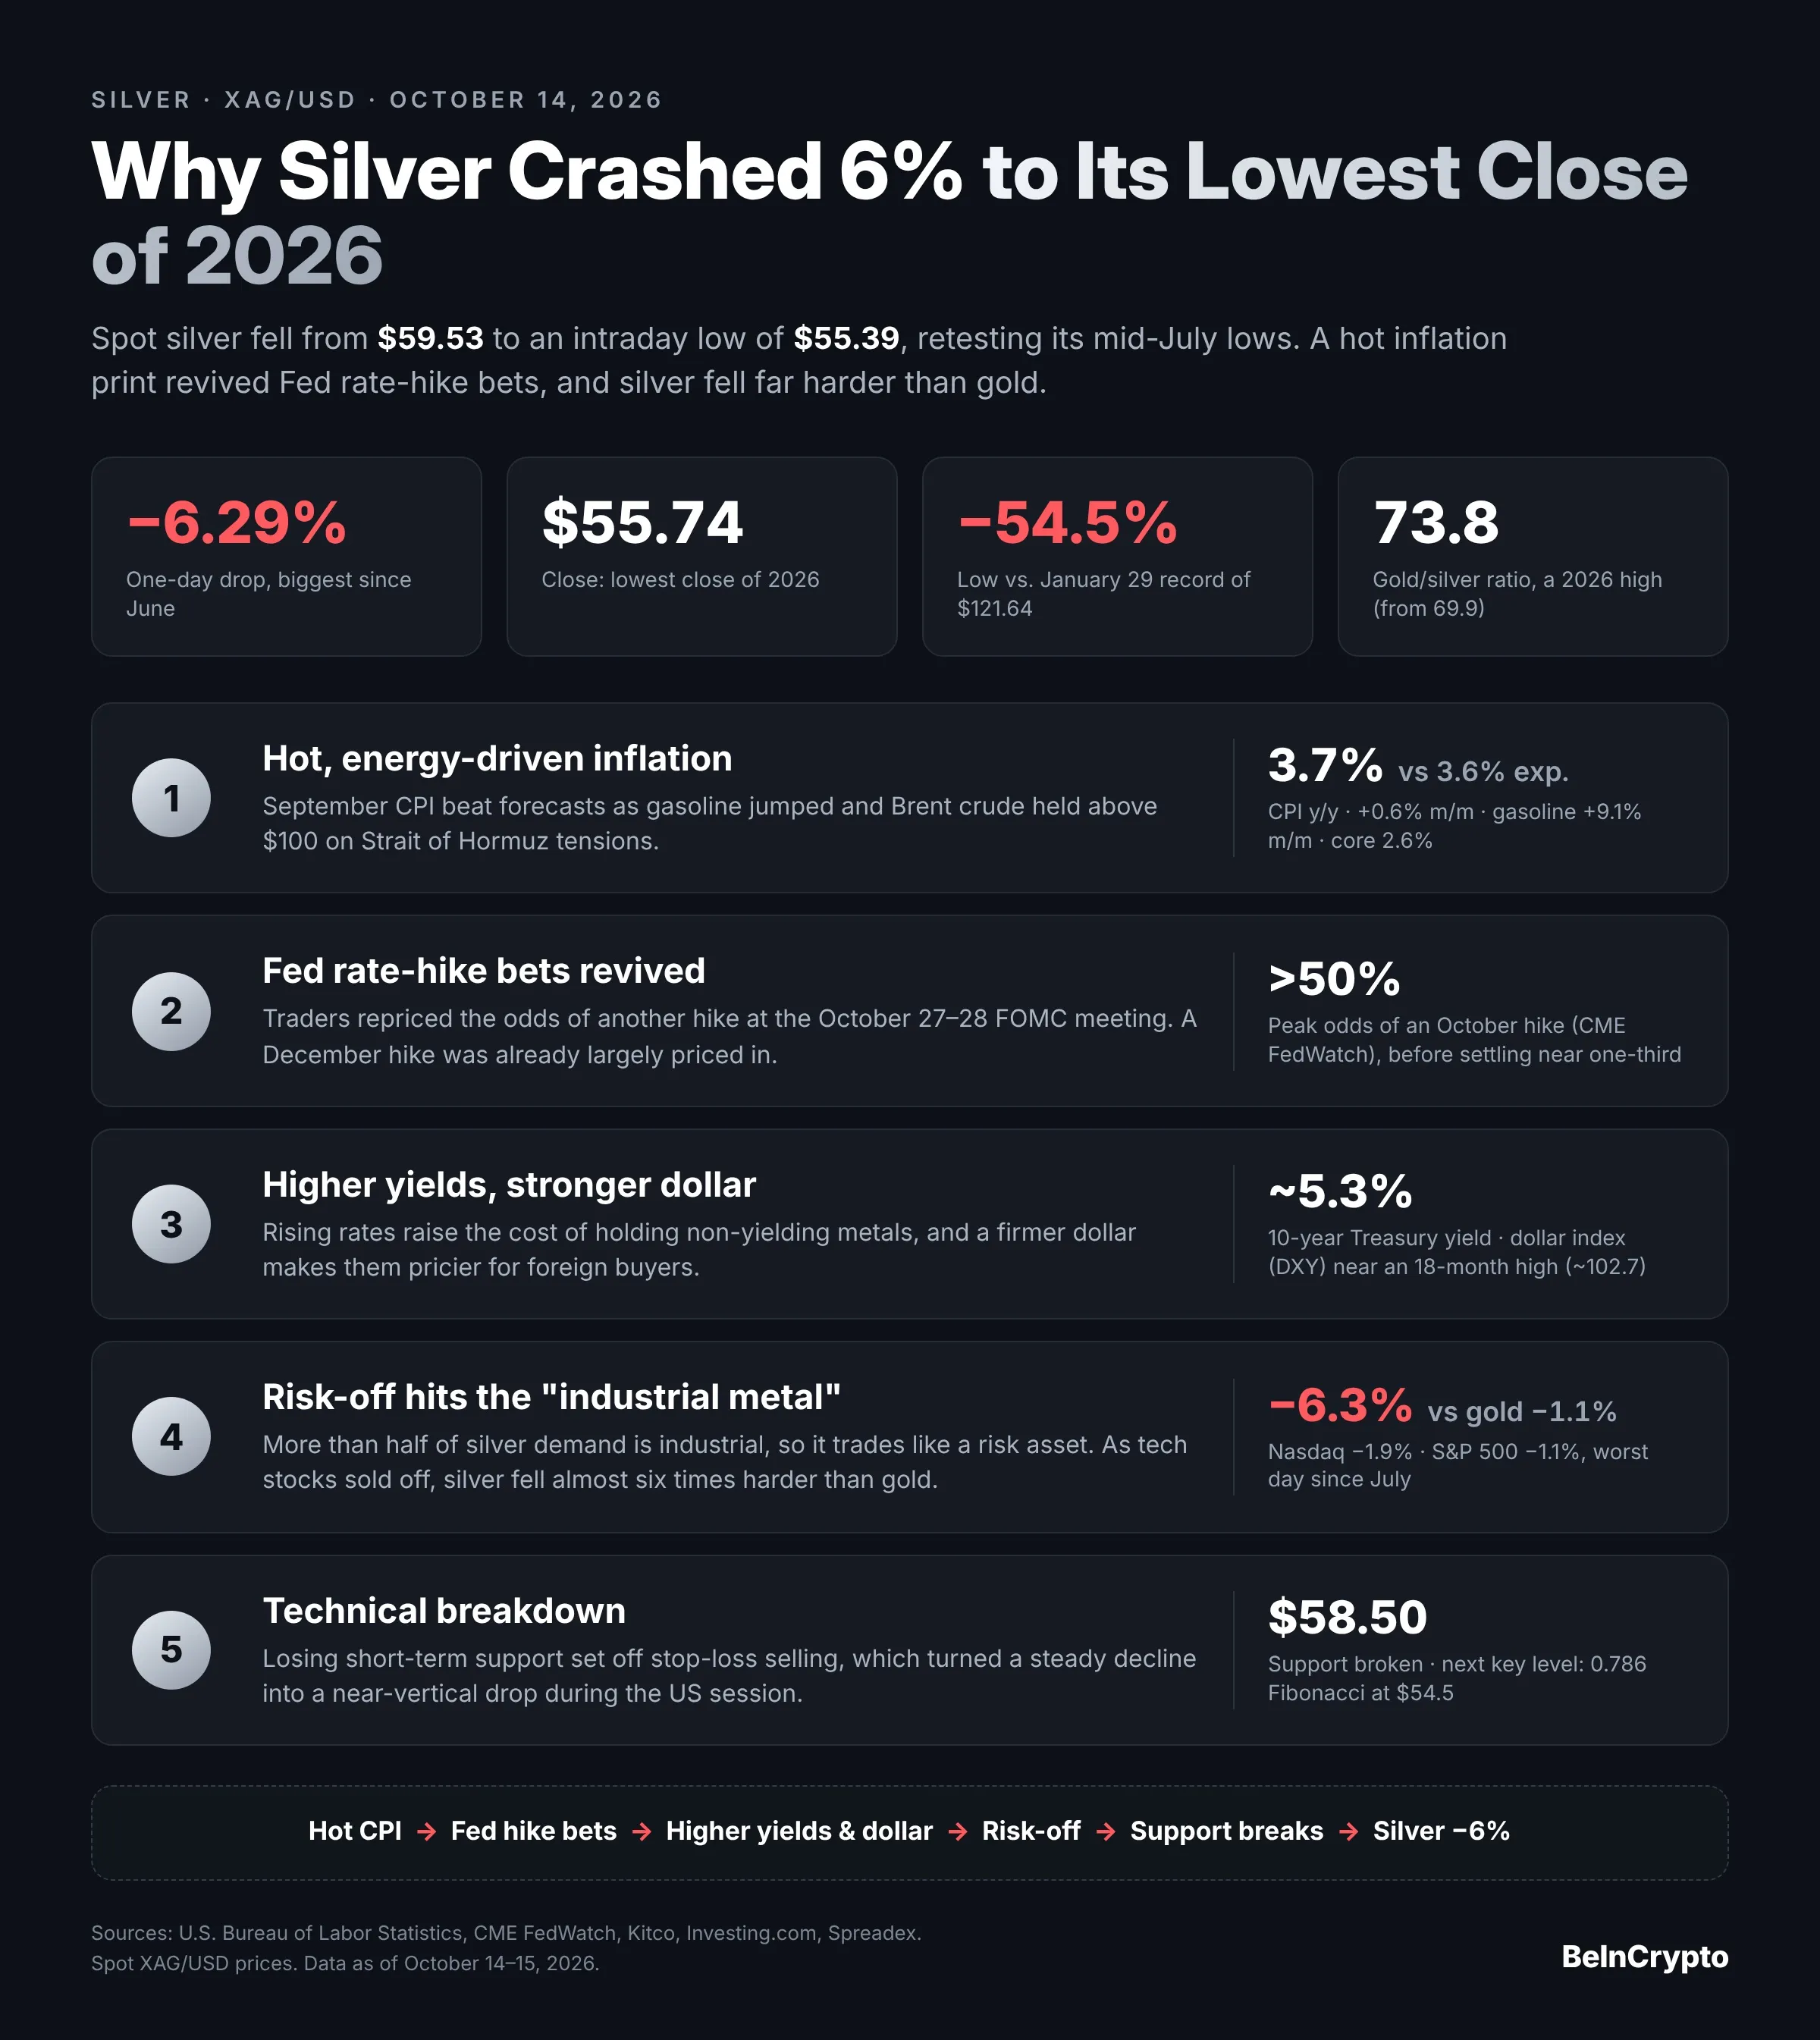
5 reasons why the silver price fell 6% Source: BeInCrypto
Sponsored
Sponsored
However, more than half of silvers demand is industrial, so it trades like a risk asset. It slid as the Nasdaq dropped 1.9%, pushing the gold-to-silver ratio to a 2026 high of 73.8.
Finally, the loss of $58.50 support triggered stop-loss selling, according to Spreadex. That turned a steady decline into a near-vertical drop.
Can $54.5 Stop Silver From Printing Another Lower Low?
Since the January peak, silver has carved out lower highs and lower lows on the daily chart. The latest lower high formed on August 28, near $70.
Still, price holds above the 0.786 Fibonacci retracement at $54.5. Traders use such levels to map pullbacks, and this one matches the late-2025 highs.
A daily close below $54.5 would confirm a fresh lower low and extend the bear trend. In that case, the round $50 mark could come into play.
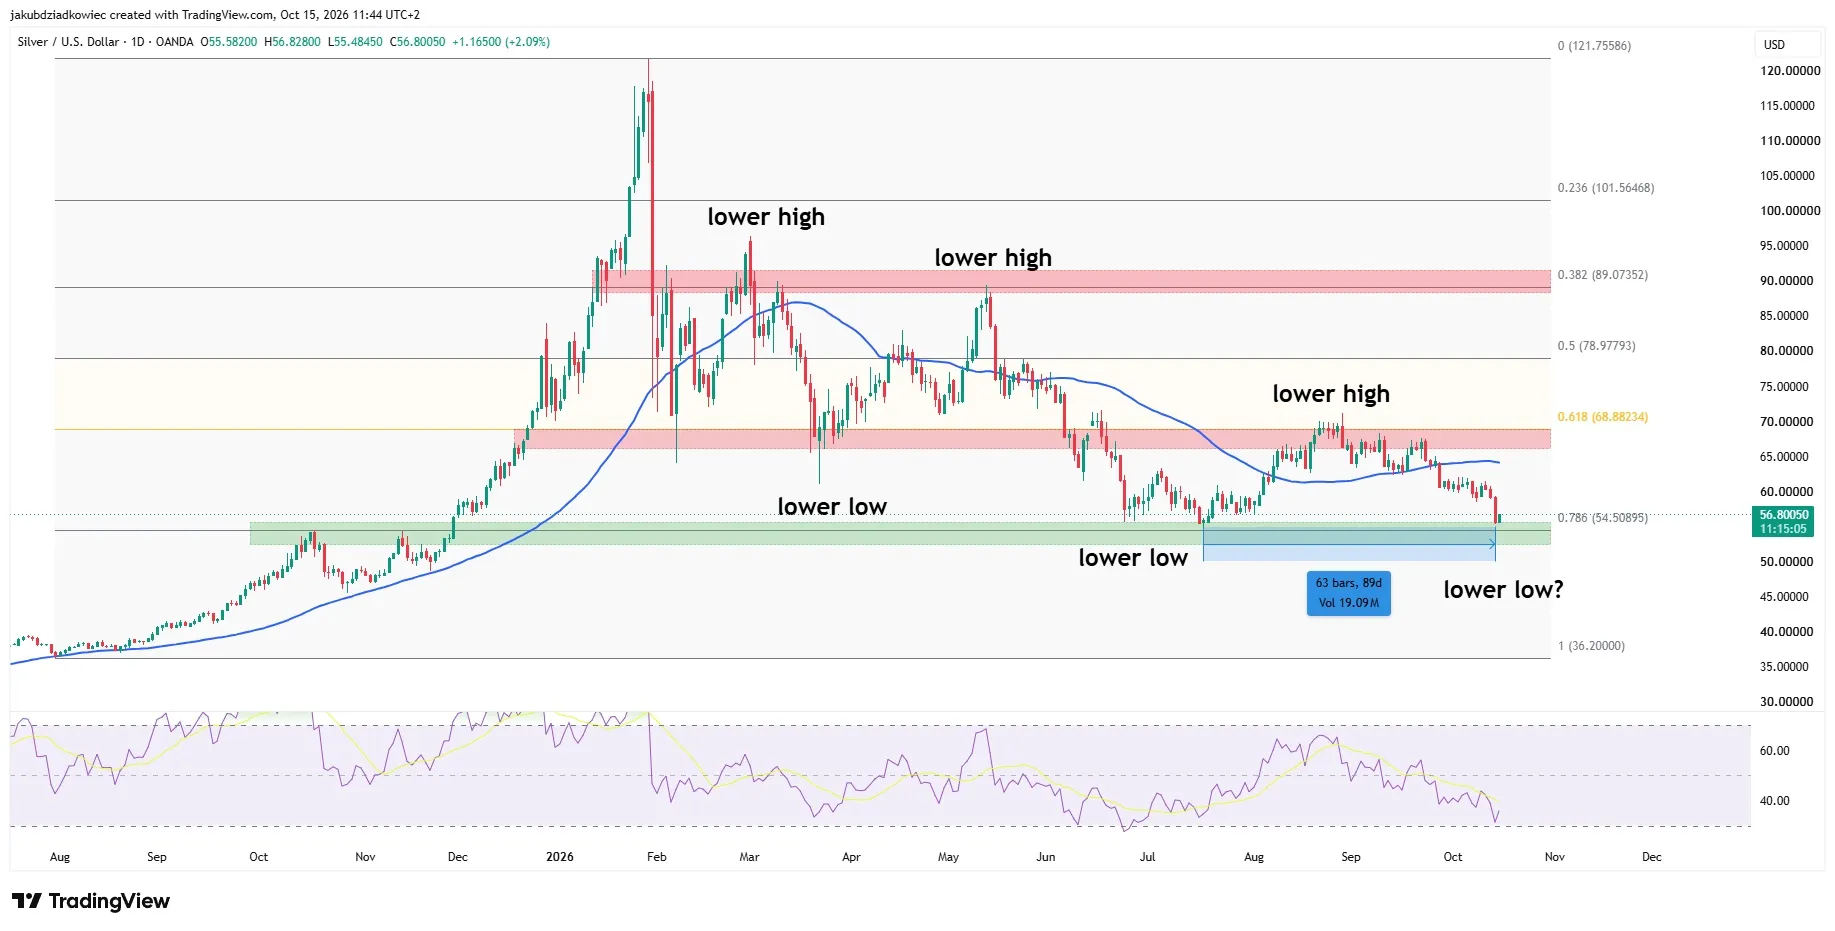
XAG daily chart Source: Tradingview
On the upside, the 0.618 Fibonacci level near $68.9 anchors a $66 to $69 resistance zone. Silver price also trades below its 50-day moving average (MA), near $64.
The Relative Strength Index (RSI), a momentum gauge, dipped close to oversold territory before bouncing to 36. That suggests sellers may be tiring, although the broader trend remains bearish.
Bargain or Value Trap? The Next Tests for Silver
Thursdays Producer Price Index (PPI) data shows that the inflation scare has legs. Fed Chair Kevin Warsh speaks on Friday, ahead of the October 27–28 Federal Open Market Committee (FOMC) meeting.
Meanwhile, Polymarket traders gave 61.5% odds on Wednesday evening that silver touches $54 in October.
For now, silver trades less on industrial demand than on how far the Fed will lift rates. Holding $54.5 would support the bargain case, while a break below it would point to a value trap.