





Today has continued with a bearish sentiment as shown by the global market cap which has recorded a 1.20% decrease in the last 24 hours to take the total market cap to 1.62T as of press time. The trading volume has however jumped by 3\8% over the same period.
Bitcoin Price Analysis
The crypto king has taken center stage again reclaiming the $43K level as bulls now dominate with the Bitcoin price standing at $42.5K as of press time representing a 3.2% pump over the last 24 hours. The trading volume has dropped by 49% within the same period to $22.6B as of press time.
An in-depth analysis of 24-hour BTC/USD charts shows that bulls are in control of the BTC markets. This is seen as the Relative Strength Index indicator, (RSI), which is moving north as it heads for the overbought region, backing the bullish prospects. The MACD is also in the green zone showing bullishness on BTC.
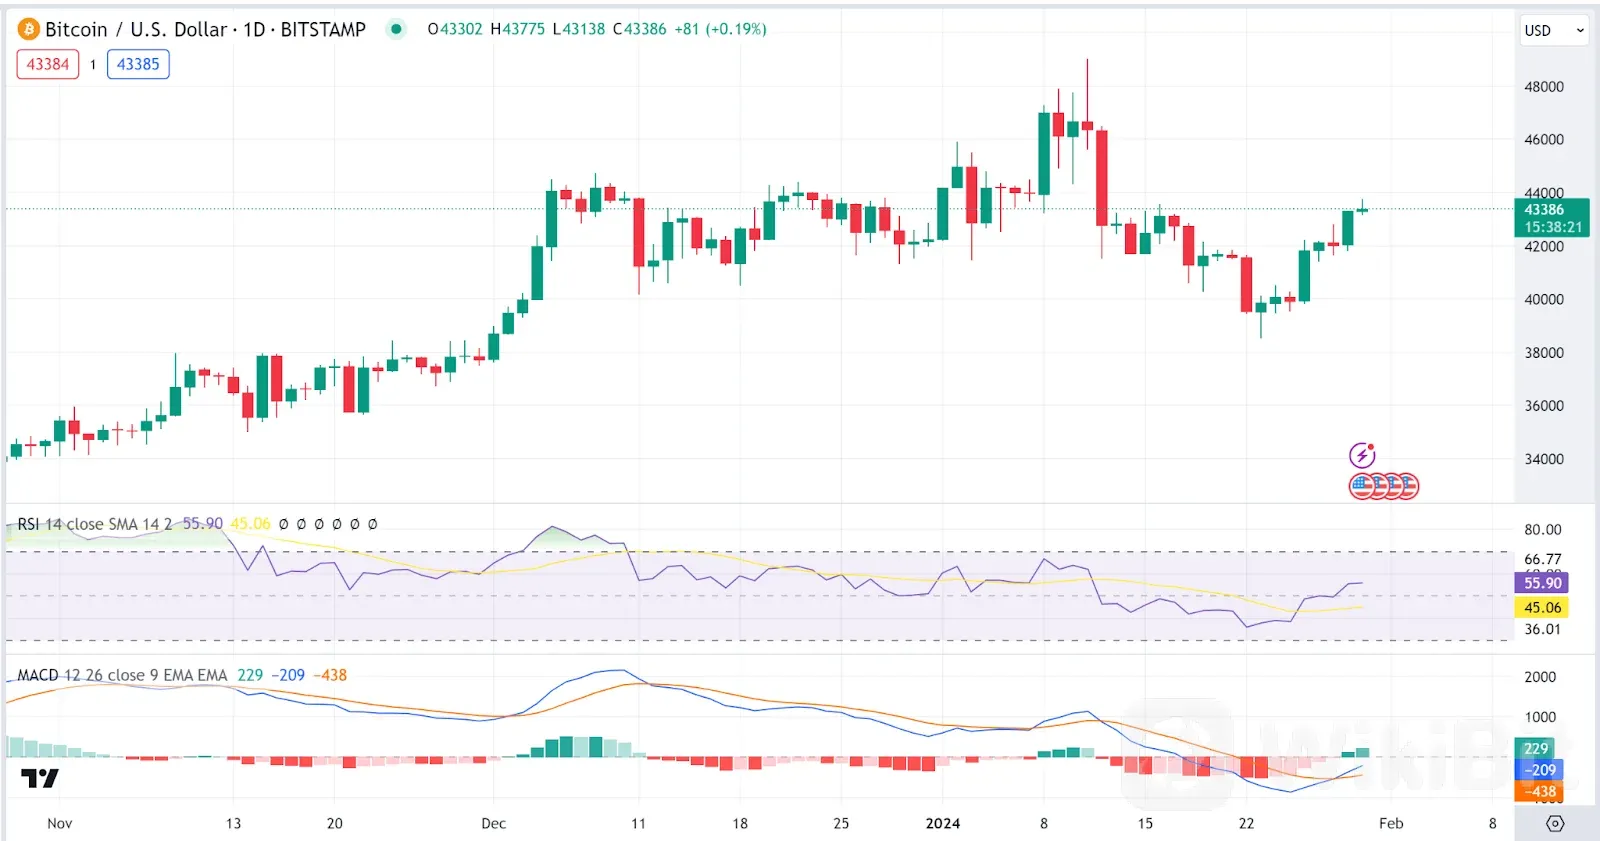
BTC 1-day chart | Source: TradingView
Ethereum Price Analysis
Ethereum is also on a strong bull trend with the Ethereum price standing at $2309 as of press time representing a 2.4% pump over the last 24 hours. The trading volume has jumped by 37% within the same period to $9.3B as of press time.
Looking at an in-depth analysis of 24-hour ETH/USD charts, we see that bulls are grappling with control of Ethereum markets as seen from the Awesome Oscillator, an indicator used in gauging trends, which is currently reverting from the negative region towards the zero line with a green histogram, suggesting fading bearishness on ETH. The RSI is however at the 50 levels indicating possible breakouts on either side as no certain dominance is established between bulls and bears.
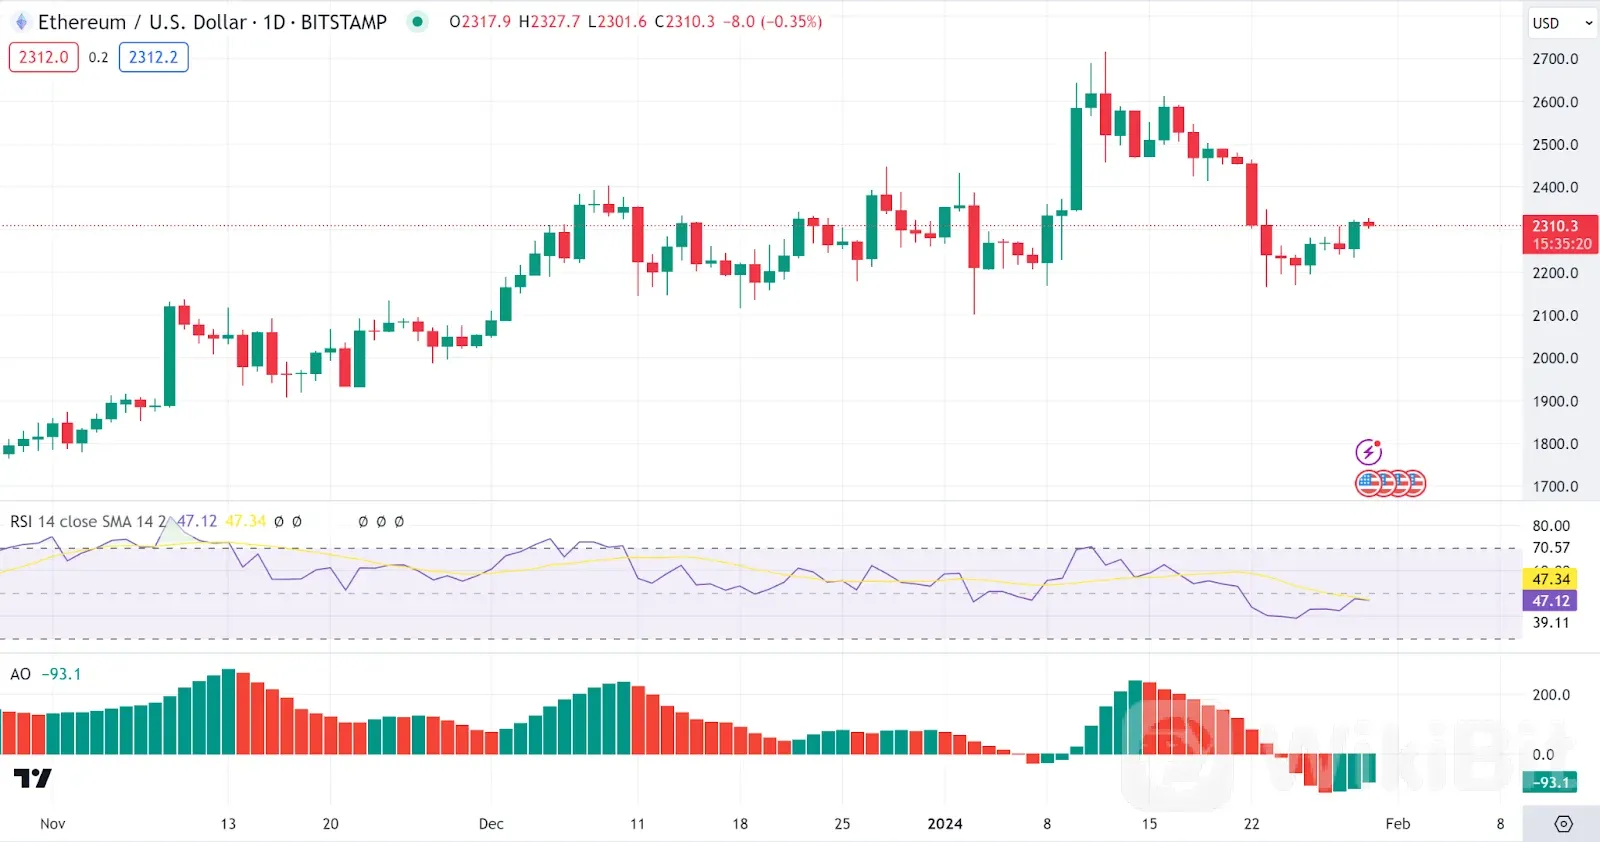
ETH 1-day chart | Source: TradingView
Conflux Price Analysis
Conflux (CFX) is however facing corrections from yesterdays pump as bears now dominate with the Conflux price standing at $0.23 as of press time representing a 3% dump over the last 24 hours. The trading volume has dropped by 22% within the same period to $115M as of press time.
An in-depth analysis of 24-hour CFX/USDT charts shows that bears are in control of the CFX markets. This is seen as the Relative Strength Index indicator, (RSI), which is reverting from its north trajectory, shows bullish prospects. On the other hand, the MACD histogram movement has flattened suggesting fading bullishness.
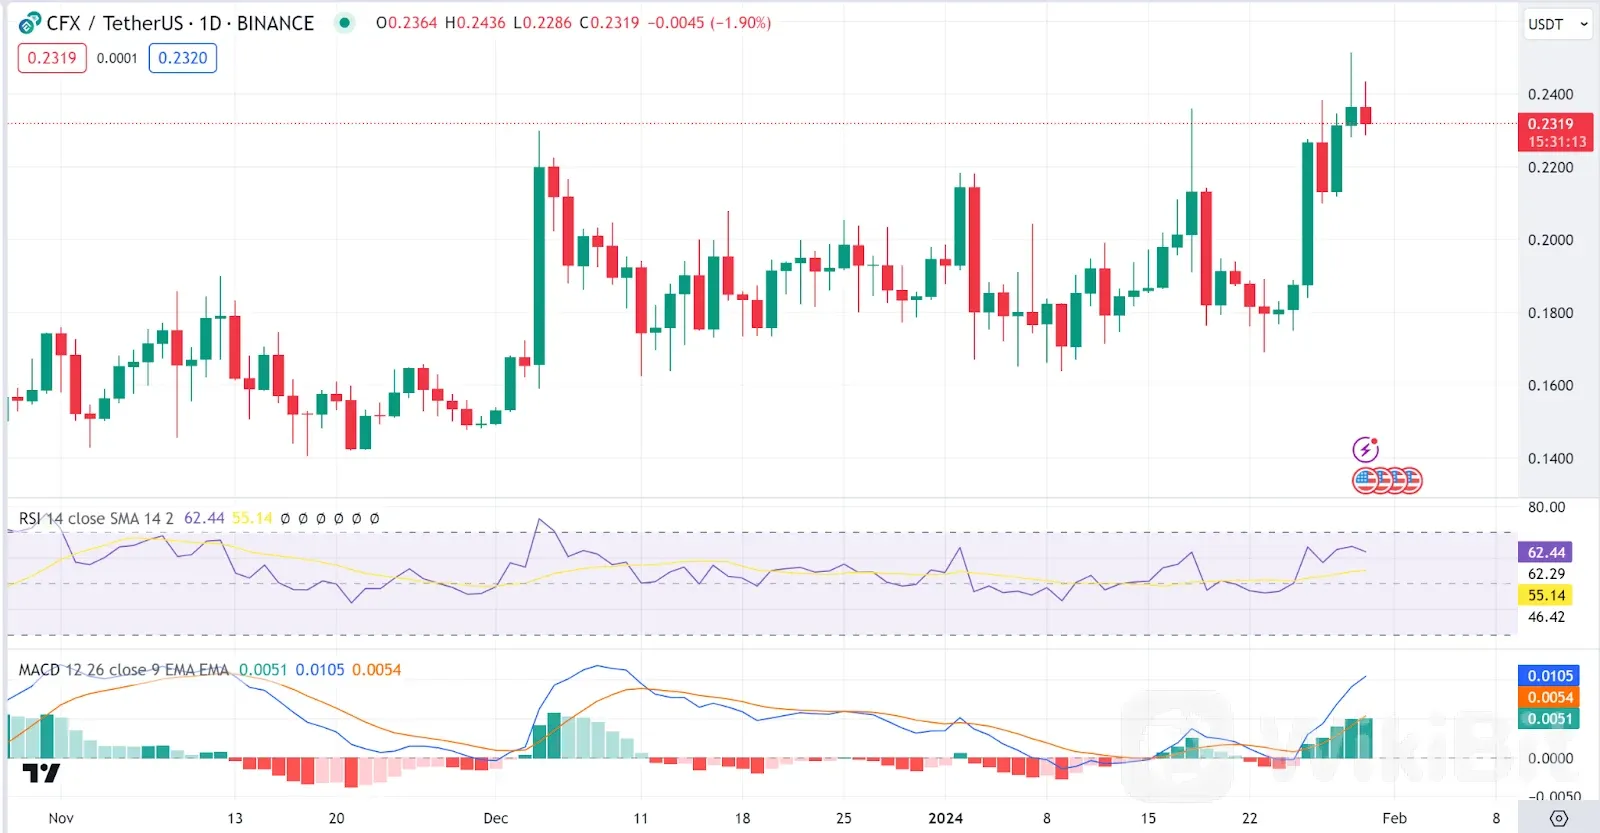
CFX 1-day chart | Source: TradingView
Sui Price Analysis
Sui (SUI) is another gainer today with the Sui price standing at $1.6K as of press time representing a 15% pump over the last 24 hours. The trading volume has doubled within the same period to $842M as of press time.
An in-depth analysis of 24-hour BTC/USD charts shows that bulls are in control of the BTC markets. This is seen as the Relative Strength Index indicator, (RSI), which is moving north as it heads for the overbought region, backing the bullish prospects. The MACD is also in the green zone showing bullishness on the Sui price
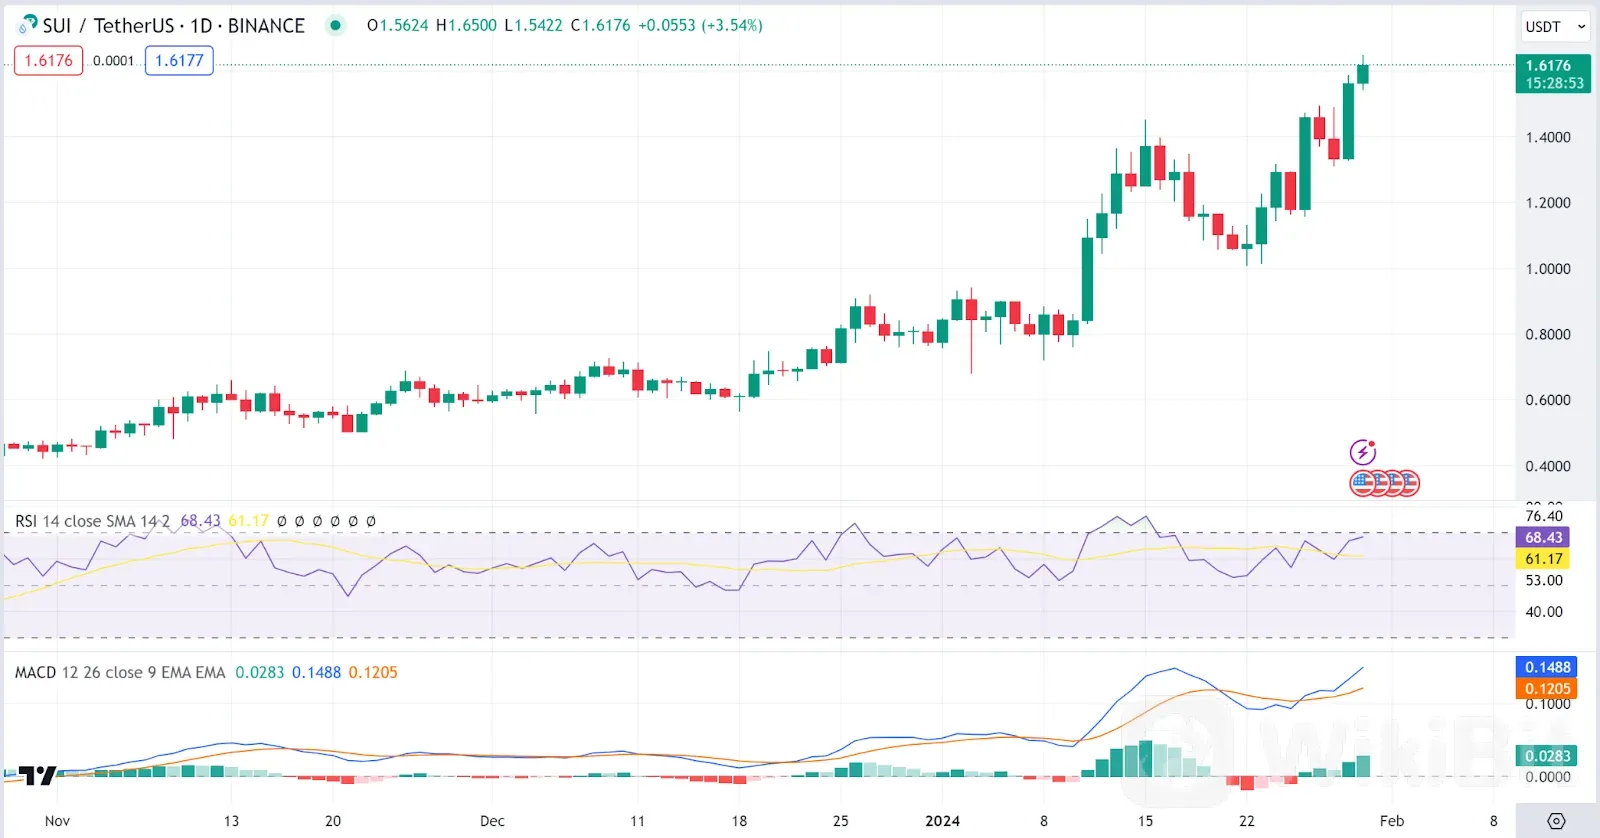
SUI 1-day chart | Source: TradingView
Lisk Price Analysis
Lisk (LSK) is our last gainer today with the Lisk price standing at $1.49 as of press time representing a 7% pump over the last 24 hours. The trading volume has dropped by 23% within the same period to $147M as of press time.
An in-depth analysis of 24-hour LSK/USD charts shows that bulls are in control of the BTC markets. This is seen as the Relative Strength Index indicator, (RSI), which is moving north as it heads for the overbought region, backing the bullish prospects. The MACD is also in the green zone showing bullishness as well on the Lisk price.
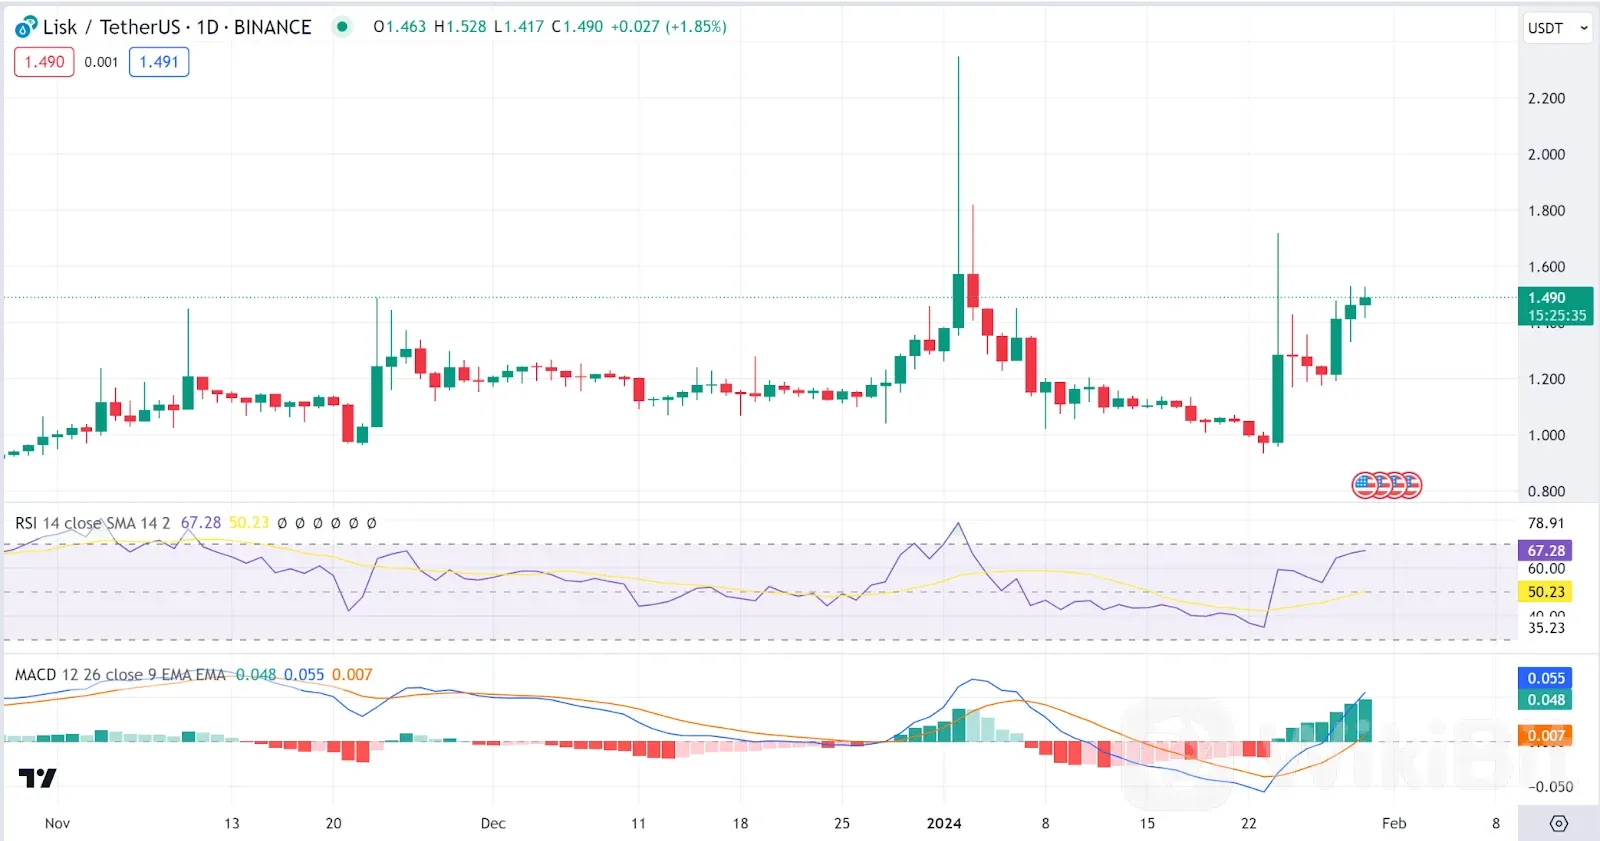
LSK 1-day chart | Source: TradingView