






Copper is testing its April support trendline, even as global copper mine supply fell 1.1% in the first half of 2026.
The metal is up more than 15% this year. Yet the shortage sits in ore, not in finished metal, which complicates the bullish case.
Sponsored
Sponsored
Why Cant Copper Mine Supply Keep Up With Demand?
Outages at Grasberg in Indonesia and Kamoa-Kakula in Congo erased about 600,000 tonnes of expected 2026 output, per Sprott. That equals roughly 2.5% of global mine supply.
Morgan Stanley now sees mine supply flat or slightly lower this year, according to its revised outlook. That would mark the first annual decline since 2017.
New supply is slow to arrive. Bringing a discovery into production takes 17 years on average, an S&P Global study found.
The squeeze already shows in ore pricing. Antofagasta sold Centinela ore at a treatment charge of minus $310 per tonne, local reports show. In effect, the miner paid the buyer.
Refined metal, however, is not scarce yet. International Copper Study Group (ICSG) data show a 131,000-tonne refined surplus in the first half, as smelters lean on scrap.
Sponsored
Sponsored
Who Pays When Copper Gets Scarce?
Artificial intelligence (AI) data centers are among the most exposed buyers. A 1-gigawatt AI campus can need up to 50,000 tonnes of copper, Industrial Info Resources estimates.
Cost is a minor issue, since copper is under 0.5% of a data centers budget. Delays in transformers and cables pose the bigger risk.
The long-term gap looks wider. S&P Global projects 2040 demand at 42 million tonnes, leaving supply roughly 10 million tonnes short.
Meanwhile, Comex warehouse stocks hit a record near 700,000 tonnes in September. Traders are front-running a proposed 15% tariff on refined imports from 2027.
Can Copper Hold Its April Trendline?
Copper is now testing its ascending support line for the fifth time. The line held on four earlier tests in June, July, September, and early October.
Price also sits just below a horizontal resistance zone near $6.70 per pound, which has capped rallies since May.
A confirmed breakout above that zone could open a move toward $6.95, its September record high.
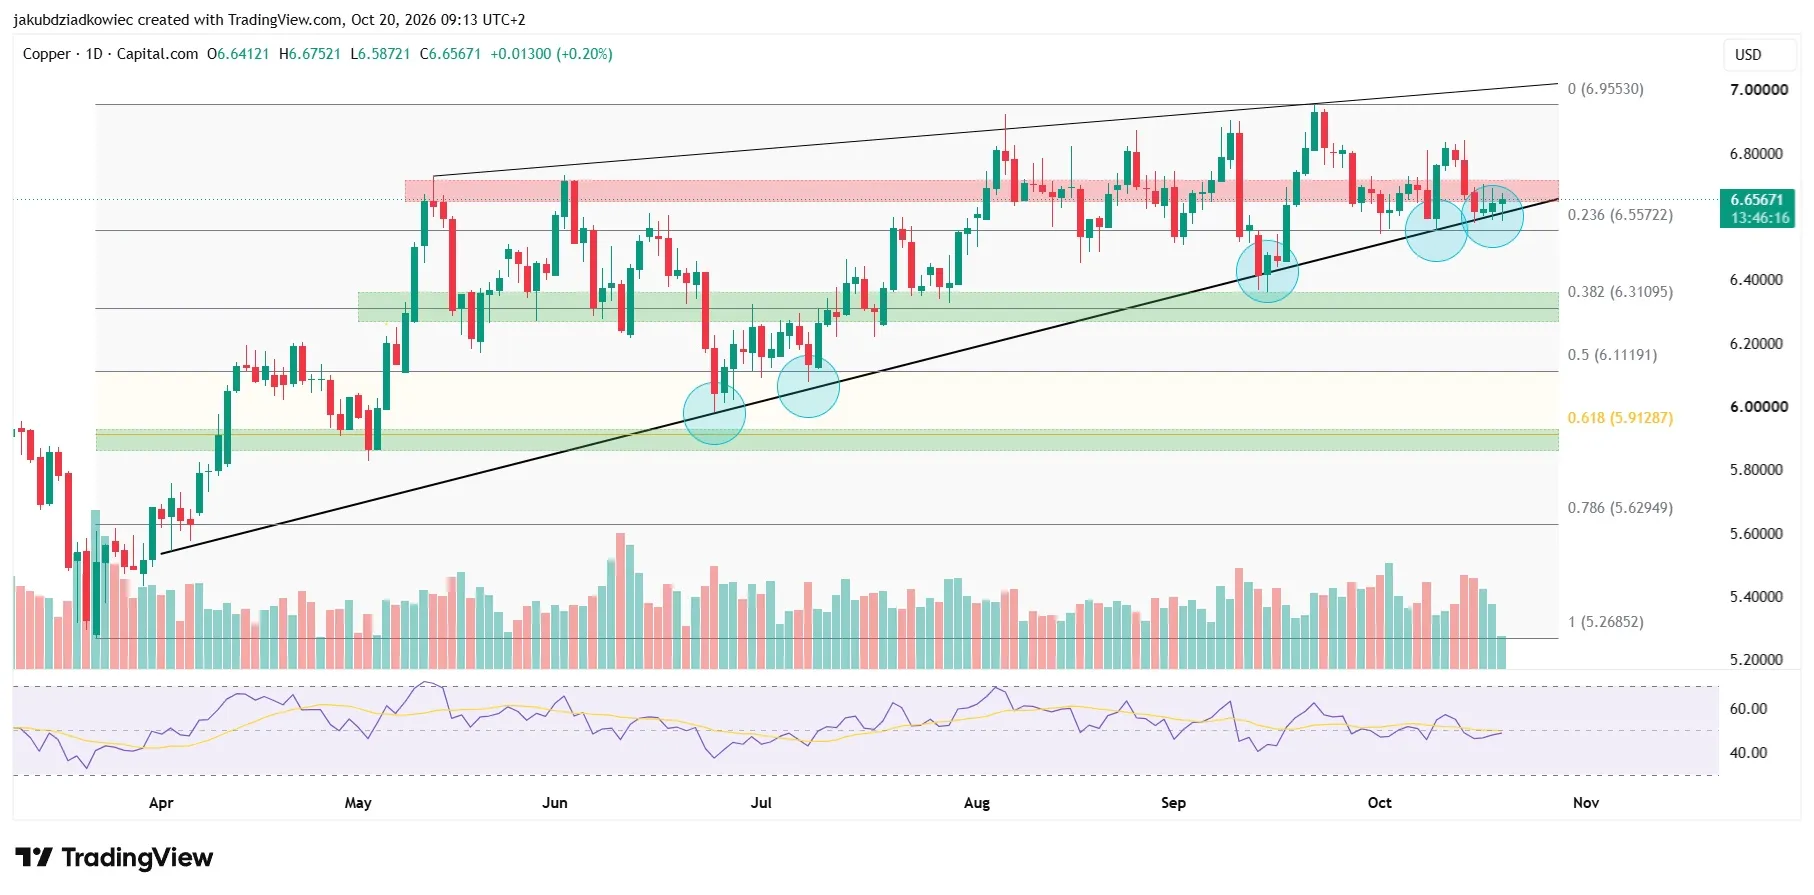
XCU daily chart Source: Tradingview
However, highs have been falling since that record, squeezing price into the trendline. If support breaks, the 0.382 Fibonacci retracement near $6.31 may act as the next floor.
The Relative Strength Index (RSI) hovers near 50, a neutral reading that favors neither bulls nor bears.
Is Copper Leaving Bitcoin Behind?
In August, coppers record close arrived alongside gains in gold and Bitcoin (BTC) during the debasement trade rally.
The two have since split. Copper is up about 33% year-over-year, while Bitcoins spot price sits near $81,700, roughly 25% lower.
They also compete for the same hardware. As miners pivot toward AI, they join data centers in the queue for copper-heavy transformers and cabling.
For now, coppers premium rests on mines rather than money printing. A break below the April trendline would test whether investors still treat it as a hard-asset hedge.