






Bitcoin‘s price held between $85,800 to $86,000 per unit on Oct. 5 at 8:45 a.m. Eastern time, with its larger trend still favoring bulls, yet the market was pressing directly into resistance rather than breaking free. Every tracked daily exponential moving average and simple moving average from 10 through 200 periods remained bullish, while momentum and moving average convergence divergence leaned bearish. With $86,949-$87,400 overhead, the charts leave bitcoin’s price strong but facing a decisive test.
Key Takeaways
- Bitcoins price held near $85,800 and $86,000 as resistance crowded the upper $86,000s.
- Daily moving averages posted 13 bullish readings, 1 neutral and 1 bearish signal.
- Bitcoin bulls face $87,400 next, while losing $85,000 would favor sellers.
Bitcoins price picture on Oct. 5 presents an intriguing contradiction: Price remains above nearly every important medium- and long-term moving average, yet the market keeps running into trouble as it approaches $87,000.
At roughly $86,084 on Bitstamp at 8:45 a.m., bulls still command the larger structure after bitcoins recovery from $74,913, but softer momentum readings and repeated resistance between the upper $86,000s and $87,400 suggest this is no clean runaway move, leaving the next break increasingly important for both sides of the tape.
1H and 4H Charts: $86,000 Becomes the Short-Term Battleground
On the 1-hour chart, bitcoins advance from roughly $84,713 to $86,969 met a sharp rejection toward $85,500 before buyers hauled the price back around $86,000. That recovery preserved the short-term structure, but the follow-through has been less convincing.
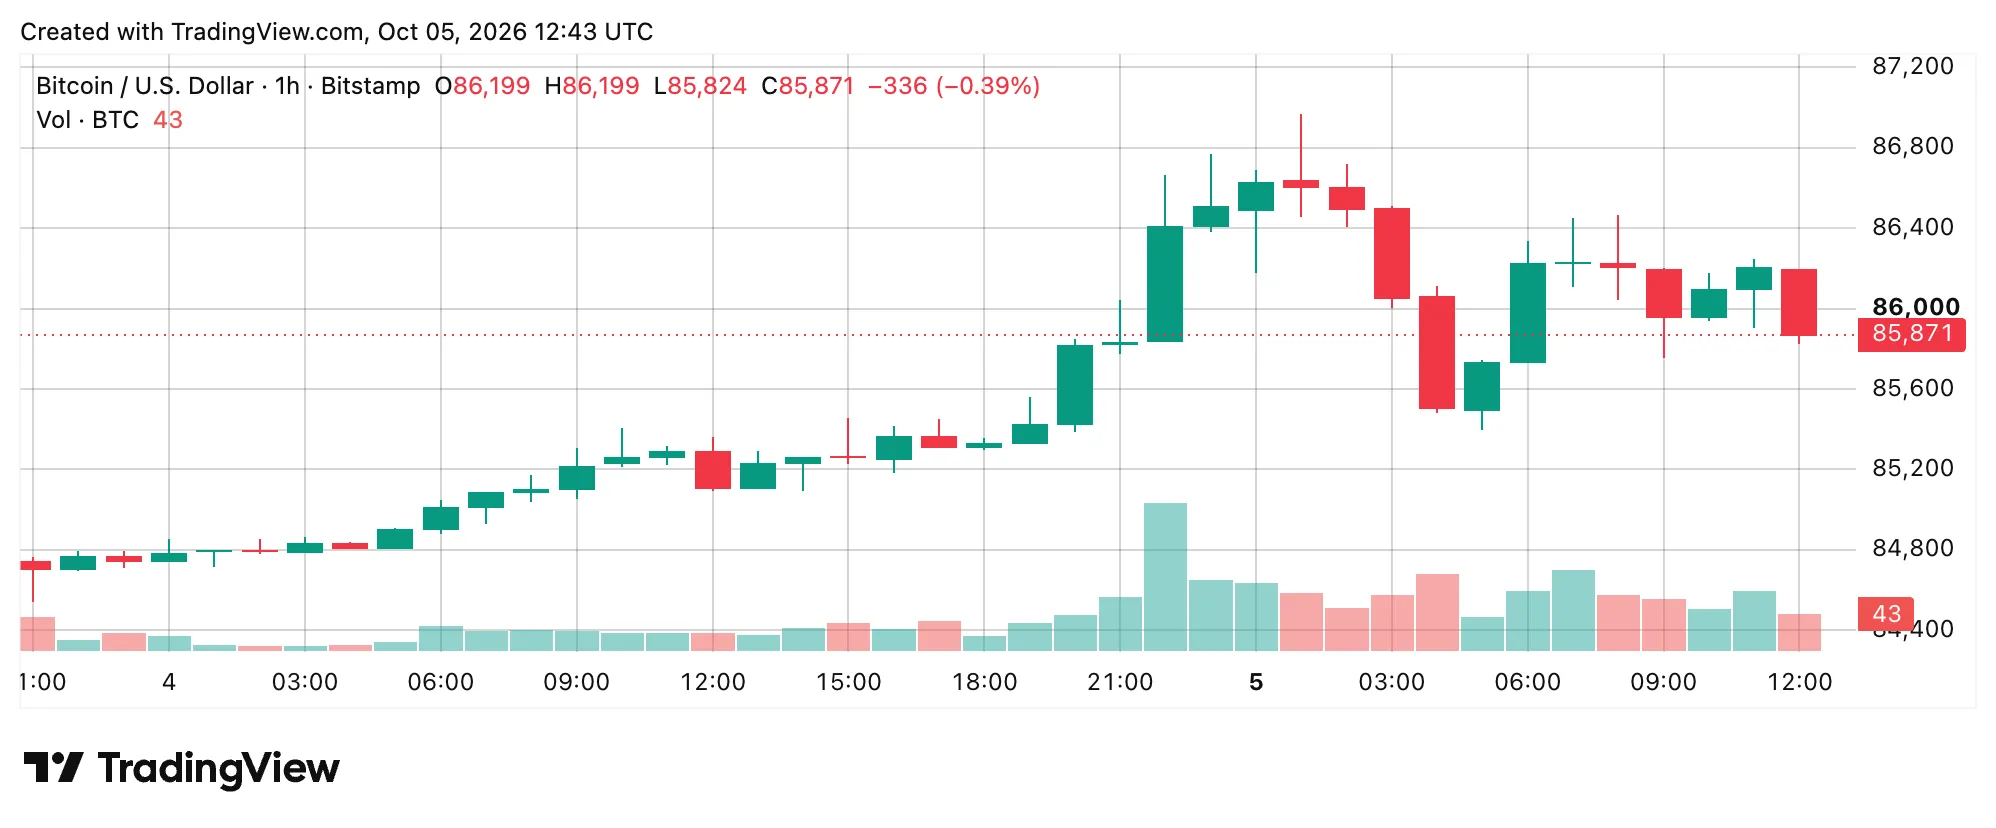
BTC/USD 1-hour chart via Bitstamp on Oct. 5, 2026.
Bitcoins price sat just below the 10-period exponential moving average (EMA) at $86,089, 20-period volume-weighted moving average (VWMA) at $86,140 and 9-period Hull moving average (HMA) at $86,136. Meanwhile, the $85,428 classic pivot offers a nearby line in the sand if sellers press again.
The 4-hour chart tells a steadier story. Bitcoin rebounded from approximately $82,870, established higher lows, and eventually reached $87,219 before settling into consolidation around $86,000.
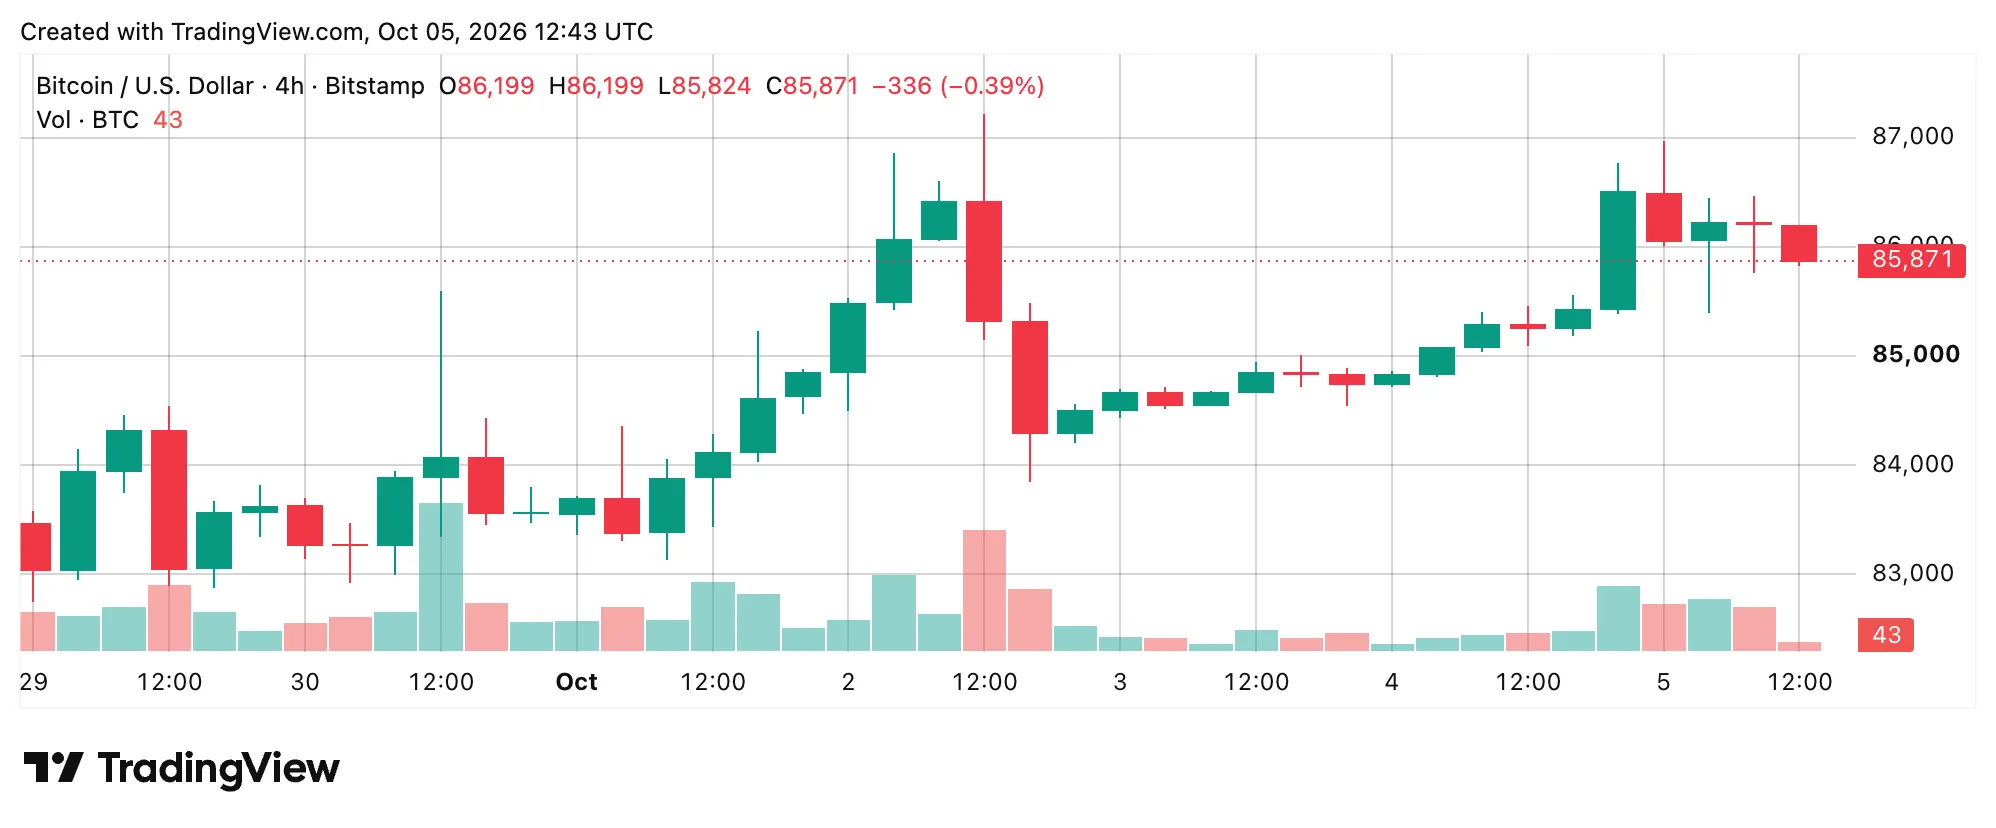
BTC/USD 4-hour chart via Bitstamp on Oct. 5, 2026.
Rather than coughing up much of that advance, the market has remained relatively close to the local peak, keeping the short-term structure tilted upward. The catch is resistance. A break through $87,000-$87,219 would strengthen the breakout case, while losing $85,000 would put the $84,300-$84,500 region back under scrutiny.
Daily Chart Keeps Bulls in the Drivers Seat
The daily chart carries considerably more weight for bulls. Bitcoin has rebounded from the labeled $74,913 low and recently challenged $87,374, while the supplied chart shows several sessions concentrated largely between $83,500 and $87,000 rather than retracing the preceding advance.
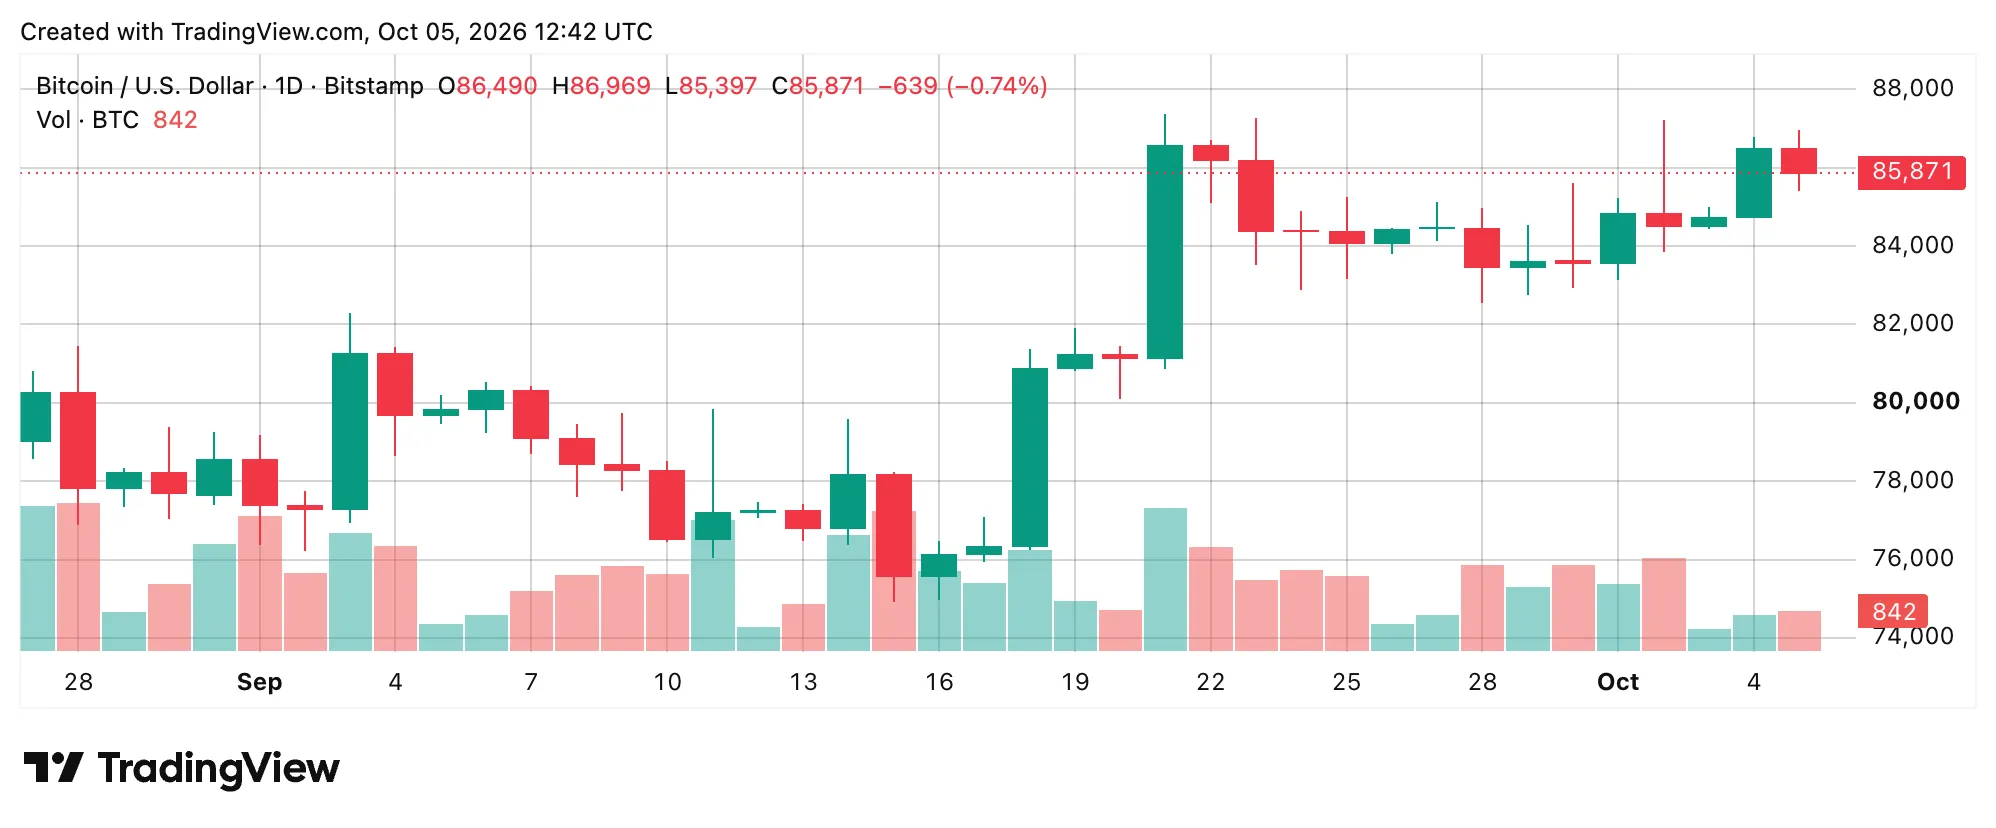
BTC/USD 24-hour chart via Bitstamp on Oct. 5, 2026.
Daily Fibonacci R1 stands at $86,710, Camarilla R3 at $86,989 and classic R1 at $88,986. That makes the upper $86,000s a crowded technical neighborhood, with a sustained move through roughly 87,200-87,400 needed to clear the immediate ceiling convincingly.
Momentum Refuses to Join the Party
The daily charts oscillators are where the bullish case loses some shine. On the daily reading, the relative strength index (RSI) stood at 66, Stochastic at 75, commodity channel index (CCI) at 87, and average directional index (ADX) at 43, all neutral.
Momentum at 1,995 and the moving average convergence divergence (MACD) level at 2,020 pointed to bearish readings. The 1-hour picture echoed that hesitation: Momentum at minus 409 and MACD at 211 were the only negative oscillators, while the remaining readings were all undecided.
Moving Averages Draw the Battle Lines
The 24-hour timeframes moving averages (MAs) remain the strongest argument for the bulls. On the daily chart, every supplied exponential moving average (EMA) and simple moving average (SMA) from 10 through 200 periods carried bullish readings, including the 10-period exponential moving average (EMA) at $84,740 and 10-period simple moving average (SMA) at $84,624. Only the 9-period Hull moving average (HMA) at $86,097 flashed bearish signals, almost exactly where bitcoin trades on Monday morning.