




Ethereum breaks Bollinger Band resistance, signaling bullish momentum, but an analyst awaits a 30% price move.
Ethereum (ETH) kicked off the first Monday of 2026 on a strong note, with a notable rise in price, peaking at around $3,209. The crypto showed an overall positive trend, extending early-year gains as investors cautiously rebuilt positions after a period of volatility.
The price fluctuated between a low of approximately $3.12K and the high point, reflecting market caution yet solid optimism. Over the past 24 hours, Ethereum has seen a modest increase of 0.5%, maintaining a steady upward movement despite occasional retracements.
Looking at longer-term performance, Ethereum posted a 4.1% gain over the last 7 days and a 4.7% rise in the past two weeks. As the market continues to adjust, Ethereums trajectory will depend on whether this bullish sentiment can be maintained.
Ethereum Breaks Bollinger Band Resistance
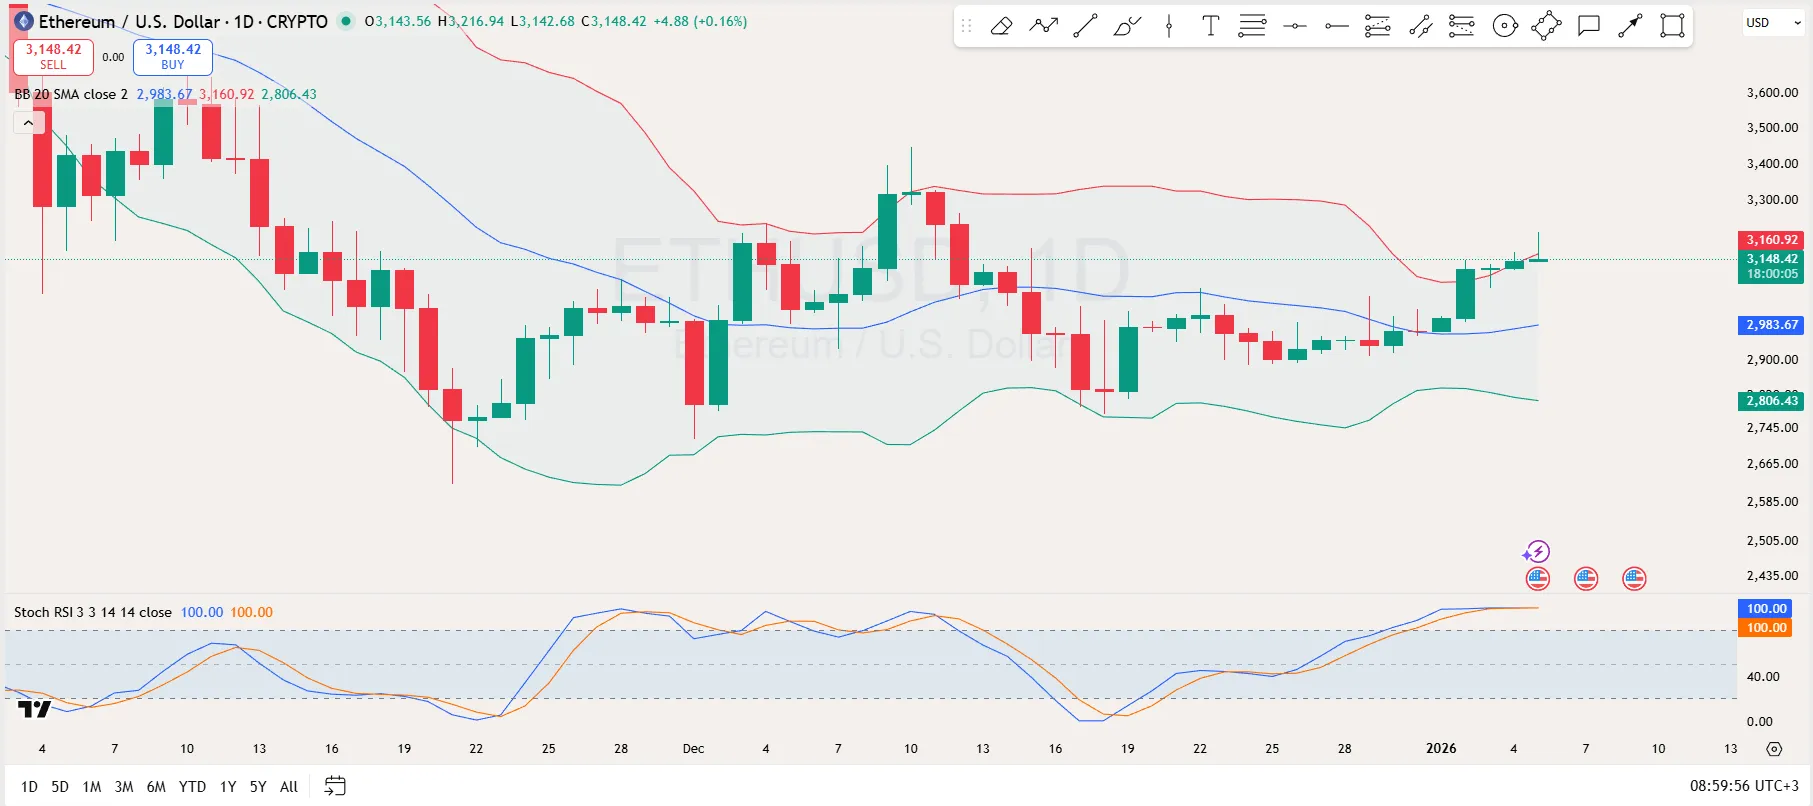
Looking at the technical chart, Ethereum has broken through the Bollinger Band resistance. The upper Bollinger Band, currently positioned at around $3,160, has given way to Ethereums price advance, indicating upward momentum and a potential continuation of the rally.
Ethereum Daily Chart
The breakout from this resistance level suggests that bullish sentiment is gaining traction, with traders eyeing higher price targets. Next, traders will be looking to breach the $3,200 zone.
Elsewhere, the Stochastic RSI indicator at the bottom of the chart reinforces this bullish view. Specifically, the indicator is currently in the overbought territory (100), signaling that the momentum is strong and could continue in the short term.
However, such an overbought condition signals that the asset may be reaching its short-term peak, and the price could face a pullback or consolidation as the momentum starts to slow down.
Additionally, caution is necessary as the price hovers at the upper boundary of the Bollinger Band, which could act as a potential resistance if Ethereum attempts to push higher. On the support side, the lower Bollinger Band, at around $2,806, provides a solid support level that Ethereum could test in the event of any downward correction.
30% Price Move Incoming?
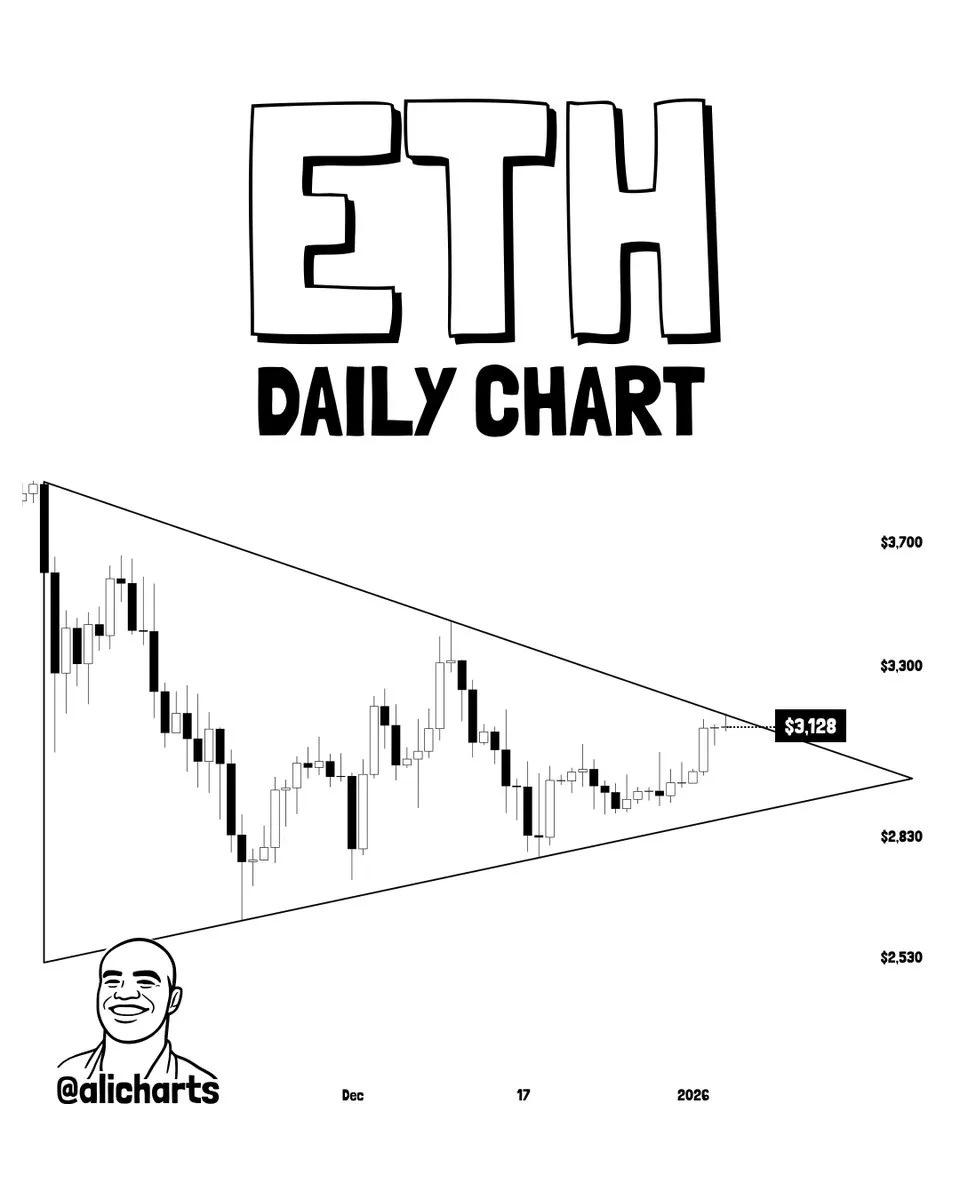
Elsewhere, expert analyst Ali Martinez highlights that Ethereum is currently in a consolidation phase, with its price movement contained within a symmetrical triangle pattern. According to Martinez, this period of consolidation is setting the stage for a significant breakout, potentially leading to a 30% price move in either direction.
Ethereum Prediction
A 30% surge from the current price of $3,151 would take Ethereum to approximately $4,096. On the flip side, a 30% dump would bring Ethereum down to around $2,206.