




$XRP price today trades near $1.3475, down 1.09% after testing the Supertrend support at $1.3273. The move places buyers at a critical level as open interest collapses and historical data suggests March typically delivers negative returns.
Open Interest Crashes 5.68% As Volume Collapses
$XRP Derivative Analysis (Source: Coinglass)
Open interest crashed 5.68% to $2.14 billion while volume collapsed 32.39% to $4.24 billion. The combination signals reduced participation and deleveraging as traders exit positions at key technical levels.
Total liquidations hit $873.05K, with shorts accounting for $831.36K. The long/short ratio on Binance sits at 2.08 for accounts and 2.32 for top traders, showing leverage remains tilted bullish despite the asymmetric short flush.
Options volume dropped 57.54% to $2.18 million while options OI rose 0.83% to $46.22 million. The collapse in options volume reflects reduced hedging activity as traders wait for direction.
Daily Chart Shows Volume Profile Support At $1.20 To $1.40
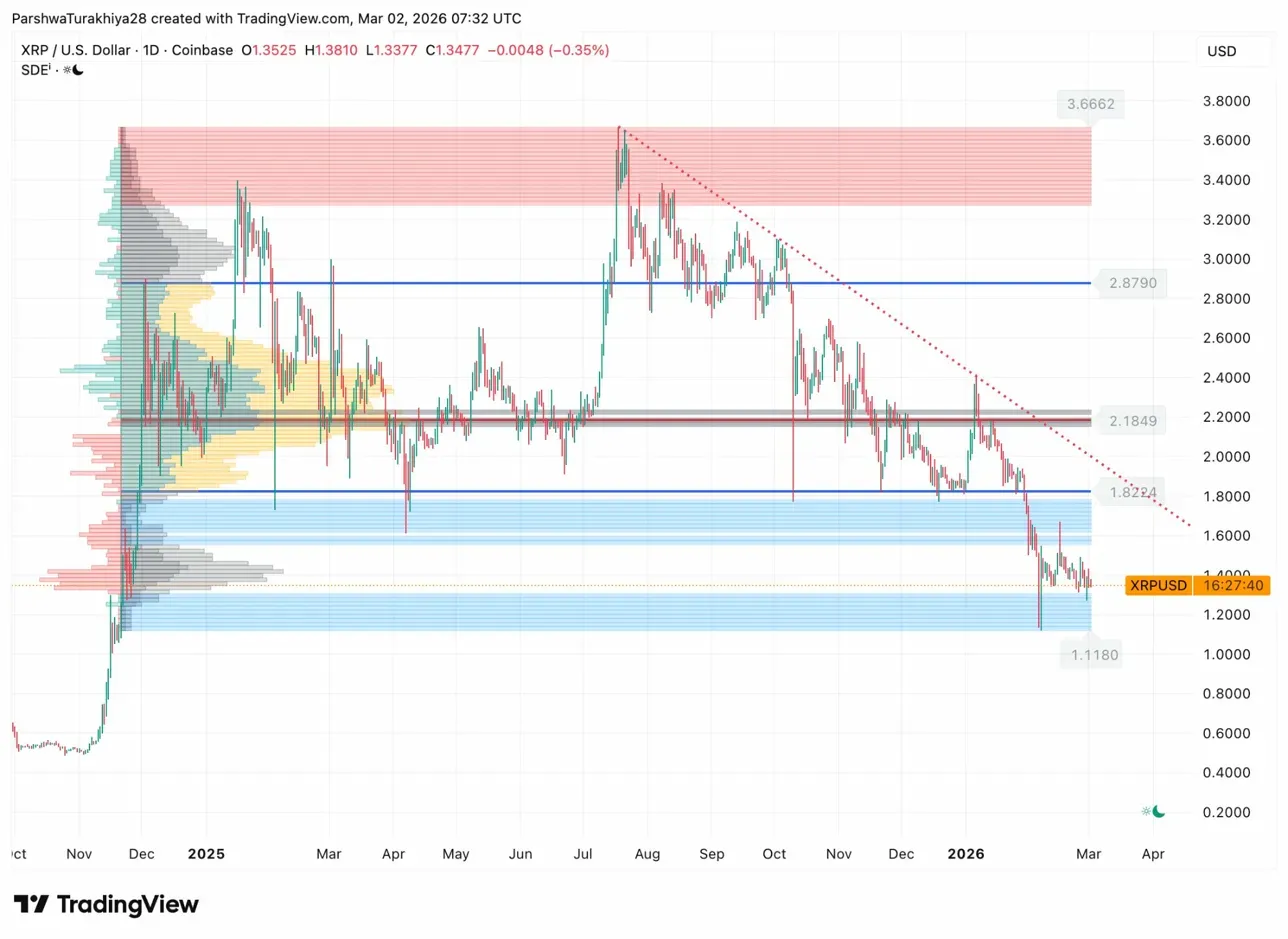
$XRP Daily Price Action With Volume Profile (Source: TradingView)
The daily chart shows $XRP trading within a high-volume node (blue shaded area) between $1.20 and $1.60, where significant trading activity has occurred over the past year. The volume profile on the left shows this zone represents the point of control where most price discovery happened.
A descending trendline (red dotted line) has capped rallies since the July 2025 highs near $3.66. Recent attempts to break above this trendline have failed, keeping price trapped in the downtrend. Multiple resistance levels sit above at $1.82, $2.18, and $2.87.
The current consolidation near $1.35 sits in the middle of the high-volume node. A break below $1.20 would exit this zone and expose the low-volume area (gray shaded) between $1.00 and $1.20, where price could fall quickly due to lack of support.
Key levels:
- High-volume support zone: $1.20 to $1.40
- Low-volume gap: $1.00 to $1.20
- First resistance: $1.82
- Major resistance: $2.18
- Descending trendline: $1.70 to $1.80
Intraday Structure Tests Fibonacci Support
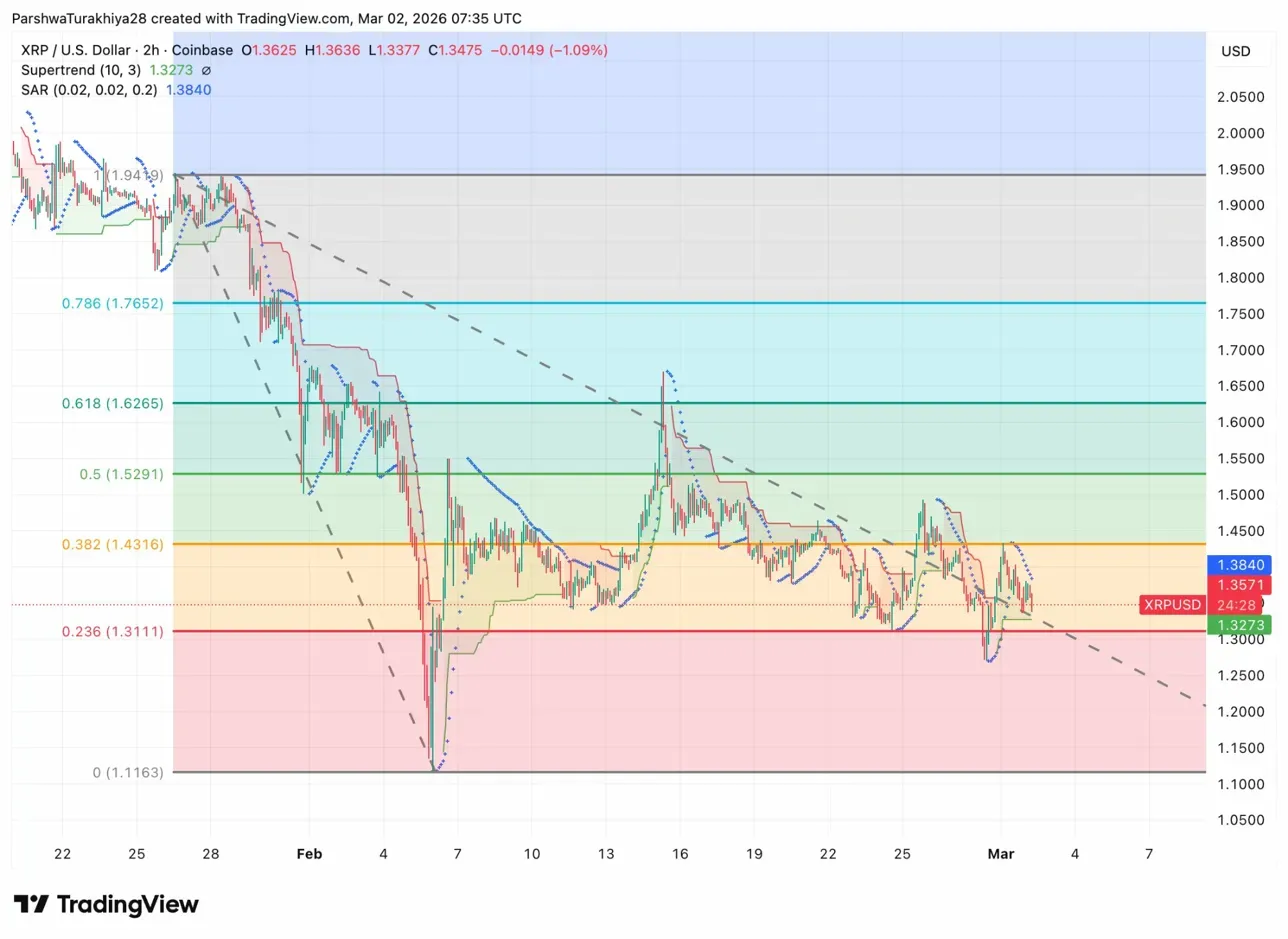
$XRP 2-Hour Price Action With Fibonacci Levels (Source: TradingView)
The 2-hour chart shows $XRP testing the 0.382 Fibonacci retracement level at $1.4316 (orange zone). The Supertrend at $1.3273 provides immediate support, while the Parabolic SAR at $1.3840 acts as resistance above current price.
Price bounced from the $1.3111 low (0.236 Fibonacci level) in late February and is now consolidating between the 0.382 and 0.5 Fibonacci levels. The 0.618 level at $1.6265 and 0.786 level at $1.7652 represent the next major resistance zones if buyers can reclaim momentum.
A descending channel (dashed gray lines) has guided price lower since late January. $XRP is currently trading near the lower boundary of this channel, suggesting either a bounce back toward the upper boundary near $1.50 or a breakdown below channel support.
Historical Data Shows March Averages Negative Returns
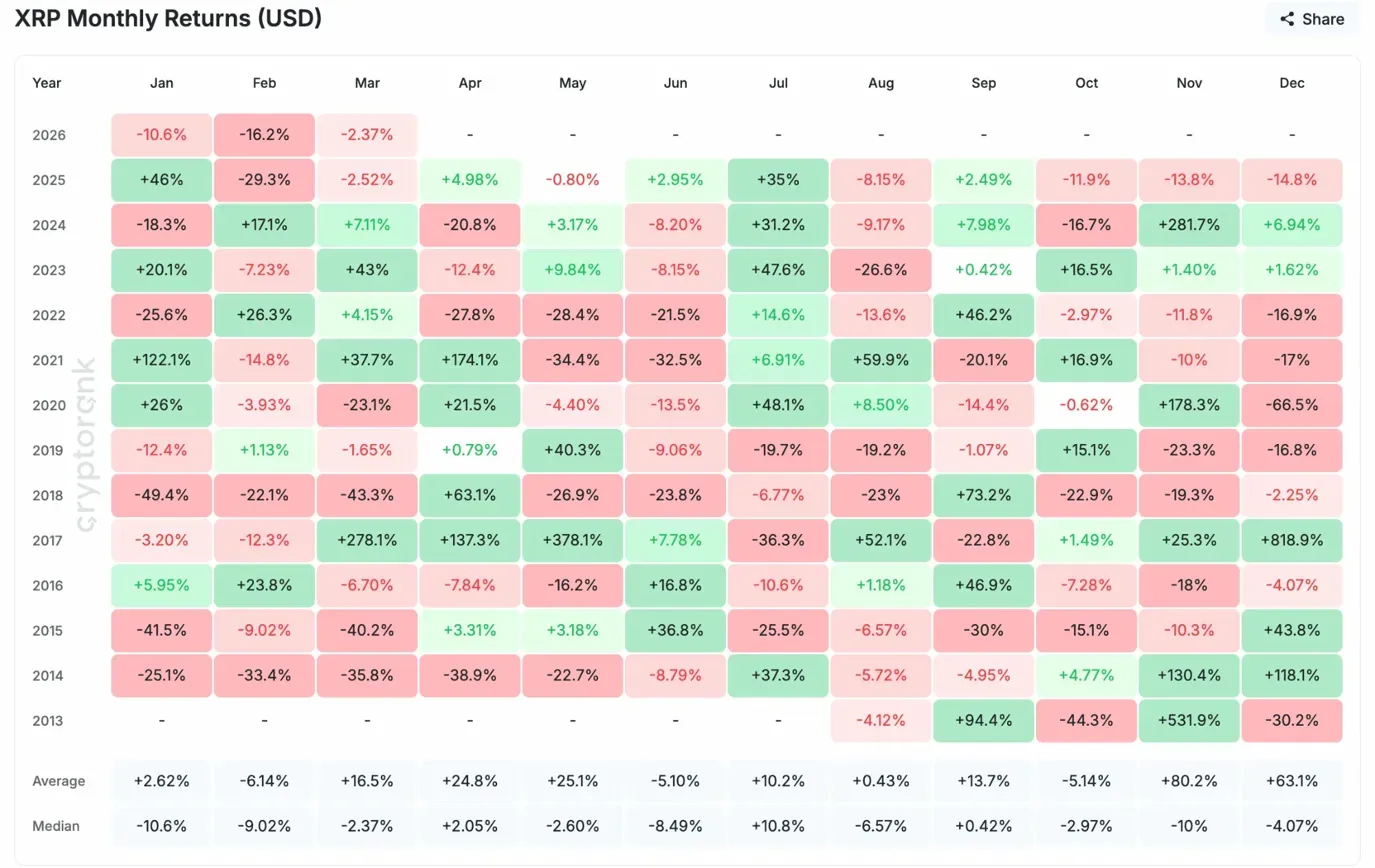
$XRP Monthly Returns (Source: Historical Data)
Historical data shows $XRP averages -2.37% returns in March, with the median also sitting at -2.37%. The month has delivered negative returns in 8 out of 13 years since 2013, including the past two consecutive Marches.
2026 year-to-date performance shows January down 10.6%, February down 16.2%, and March currently tracking -2.37%. This marks three consecutive months of losses, placing 2026 among the weaker years in $XRPs history.
The worst March performances occurred in 2018 (-43.3%), 2015 (-40.2%), and 2014 (-35.8%). The best March performances happened in 2017 (+278.1%), 2023 (+43%), and 2021 (+37.7%).
Outlook: Will $XRP Go Up?
The next move depends on whether $XRP can hold the Supertrend support at $1.3273 or if sellers push through to test the low-volume gap below $1.20.
- Bullish case: $XRP defends $1.3273 and breaks above $1.3840 with rising volume. That reclaims the Parabolic SAR and targets the 0.5 Fibonacci level at $1.5291, potentially invalidating the negative March historical trend.
- Bearish case: A daily close below $1.3273 breaks the Supertrend and exposes the high-volume zone floor at $1.20. Losing that level opens the low-volume gap toward $1.10 and aligns with historical March weakness.
Disclaimer: The information presented in this article is for informational and educational purposes only. The article does not constitute financial advice or advice of any kind. Coin Edition is not responsible for any losses incurred as a result of the utilization of content, products, or services mentioned. Readers are advised to exercise caution before taking any action related to the company.