




Ethereum is holding a major Fibonacci level while compressing inside a long-term triangle. A confirmed breakout could first send $ETH back toward $4,865-$4,900, with $8,300-$10,000 becoming possible later.
Ethereum Triangle Breakout Could Put $4,900 Back in Play
Ethereum is compressing between a long-term rising support line and the downtrend that began near its previous record high. A confirmed breakout could reopen the path toward $4,900, followed by the charts more ambitious $8,300 and $10,000 targets.
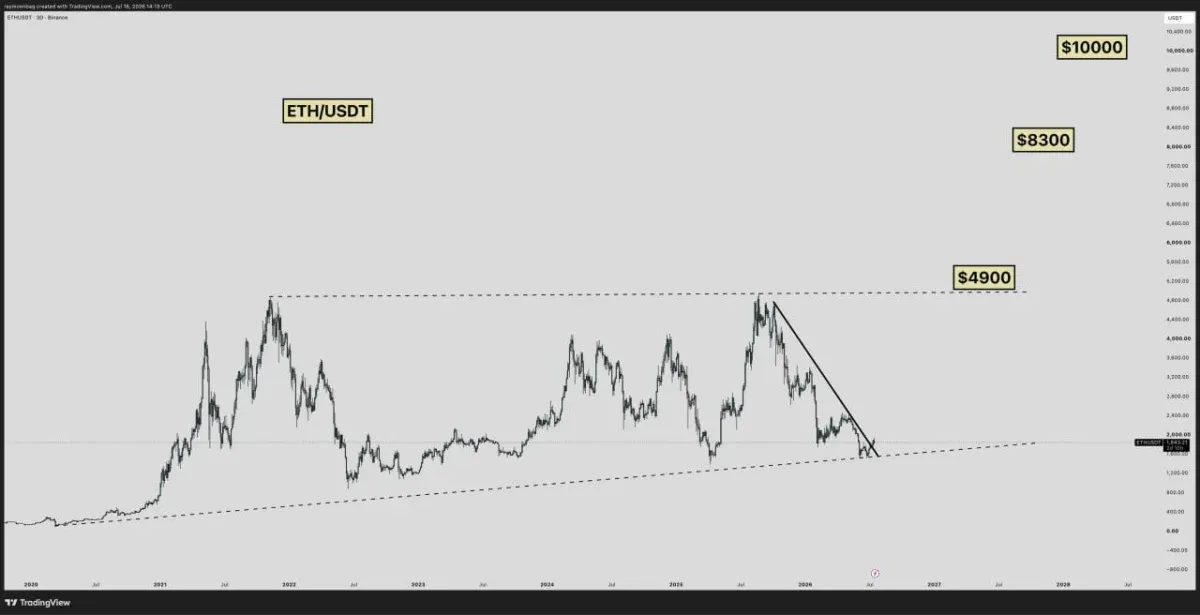
$ETH three-day chart. Source: Ray/X
The structure resembles a large multi-year triangle, with buyers repeatedly defending the rising trendline while each recovery forms a lower high. This tightening range suggests Ethereum is approaching a major decision point.
The descending resistance line remains the first obstacle. $ETH must break above it and hold the move during a retest before the setup can be treated as a reliable bullish reversal.
If buyers confirm the breakout, the previous high near $4,900 would become the first major target. Moving beyond that level would place Ethereum in price discovery and give the higher projections near $8,300 and $10,000 more technical relevance.
However, the long-term support line remains critical. A sustained breakdown below it would invalidate the triangle breakout scenario and increase the risk of a deeper correction before Ethereum attempts another recovery.
Ethereum Retests 0.618 Support as $4,865 Comes Back Into Focus
Ethereum has returned to the 0.618 Fibonacci support near $1,843, a level that previously marked the start of a major recovery. Holding this zone could strengthen the case for another long-term rebound.
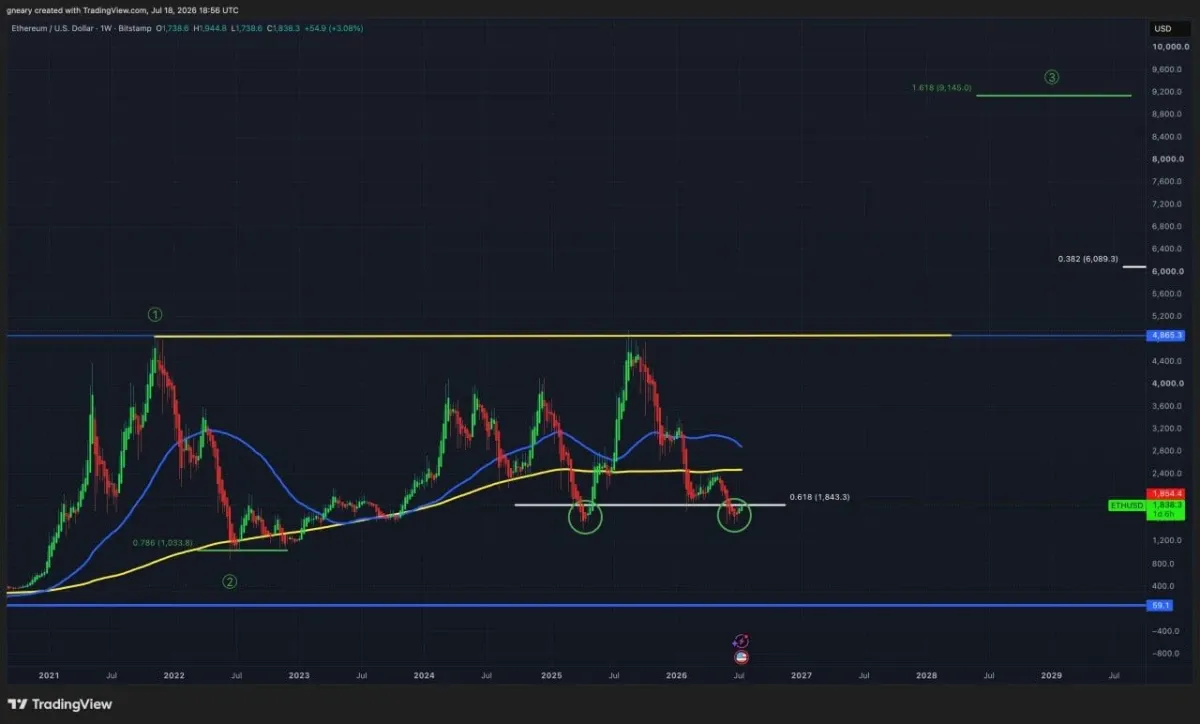
$ETH weekly chart. Source: The Long Investor/X
The chart compares the current setup with May 2025, when $ETH recovered from roughly $1,379 and later reached the previous high near $4,865. This time, Ethereum briefly dropped toward $1,510 before moving back to the same Fibonacci area.
A sustained recovery above $1,843 would be the first positive signal. $ETH would then need to reclaim the moving-average resistance near $2,400-$2,900 before the wider structure turns clearly bullish.
A stronger breakout could return attention to $4,865, followed by the Fibonacci extension near $6,089. The charts longer-term projection places the next major target around $9,145.
However, the historical comparison does not guarantee the same result. A weekly close below the recent low near $1,510 would weaken the support setup and suggest Ethereums correction is not yet complete.