Netflix Stock Analysis: Bulls Regain Control Amid Key 200-Day Test
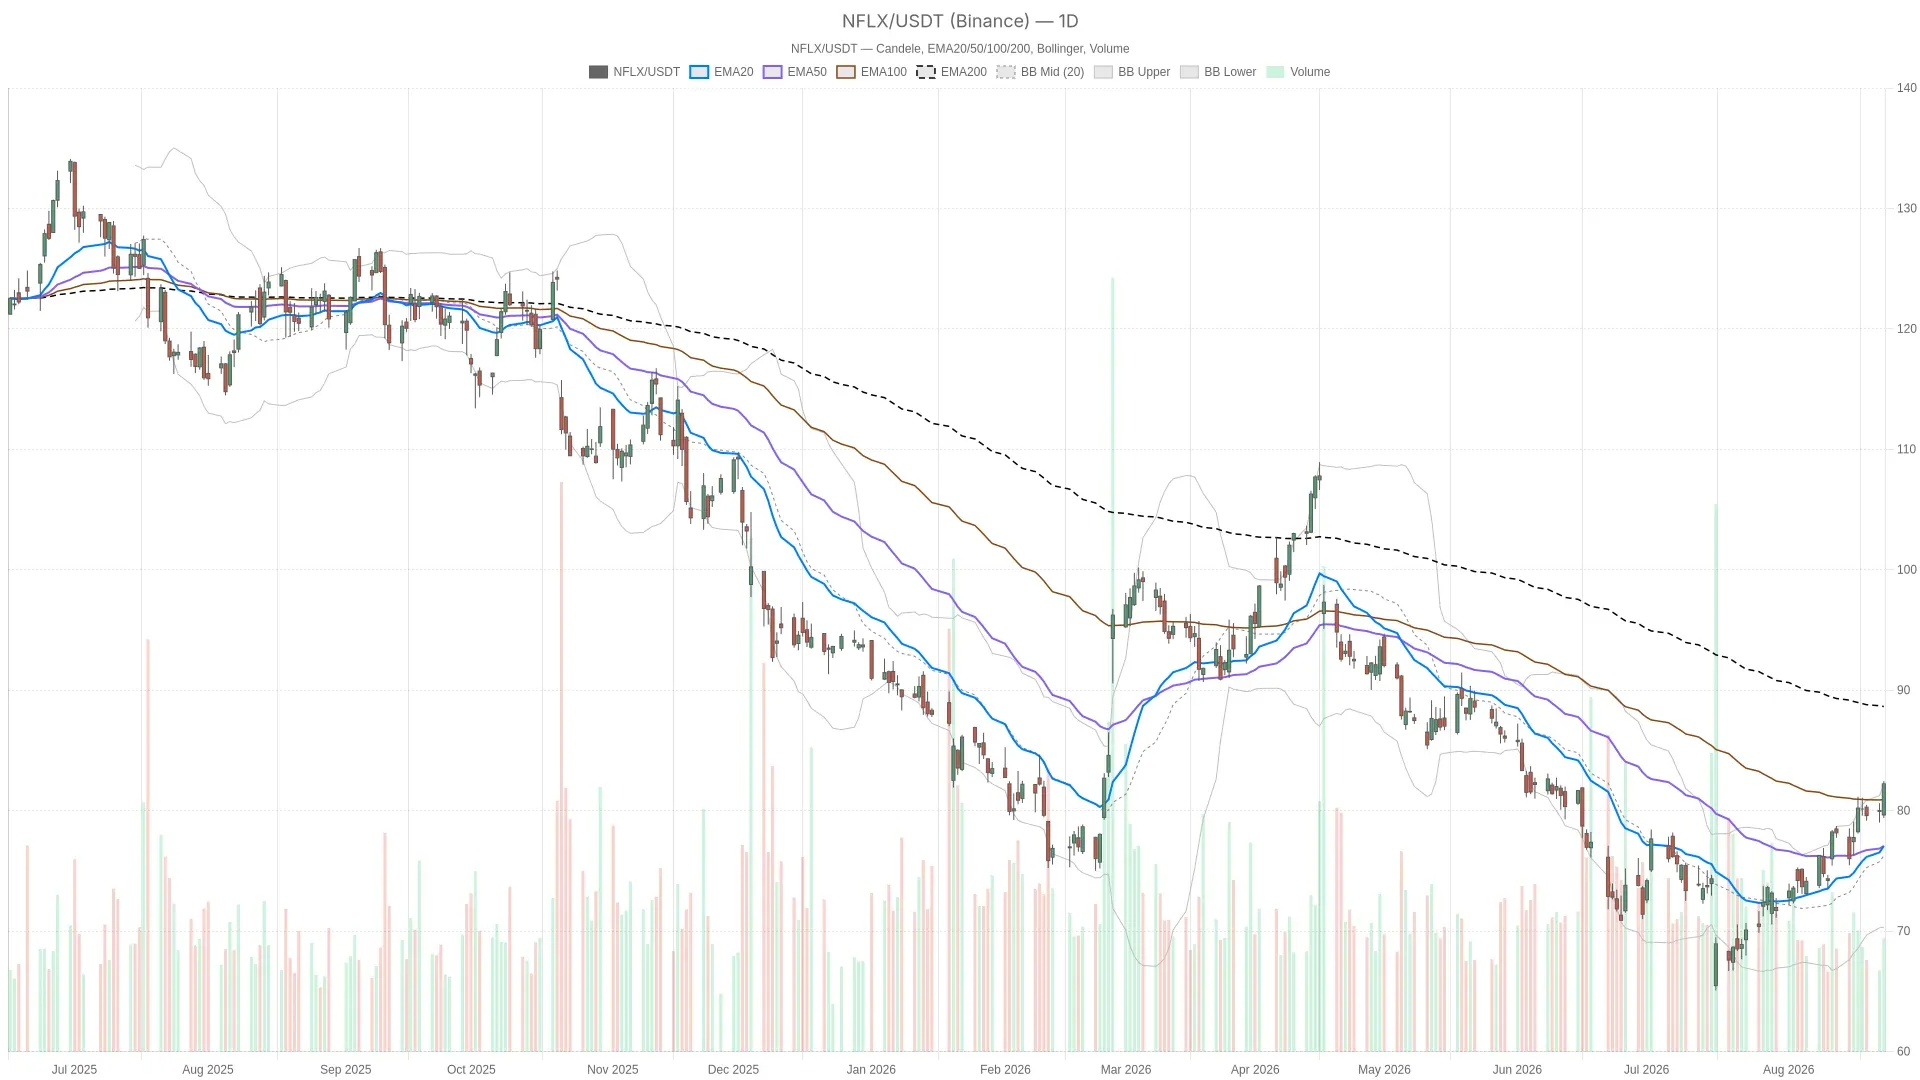
Netflix stock surged on August 25, closing at $82.23as Wolfe Research raised its price target to $95from $84. The firm called the soft second quarter a scheduling issue, with engagement data pointing to stronger results. The move gives traders a real story, not just a technical bounce. NFLX — daily chart with candlesticks, EMA20/EMA50 and volume.Key takeawaysNetflix stockclosed at $82.23 on August 25 after opening near $79.65.Wolfe Research lifted its price target to $95 from $84, citing improving engagement data.Daily RSI14 is 67.27, with the MACD line at 1.81 above its signal at 1.07.Price remains below the 200-day EMA at $88.65, keeping the daily regime neutral.The hourly chart shows a bullish EMA stack, but intraday momentum is starting to fade. Netflix Stock: Daily Structure Still Battles the 200-Day Trend The daily chart remains a battleground because momentum is strong, but the longer trend is not yet repaired. Netflix stockstill trades beneath its 200-day average even after the surge. On the daily chart, momentum indicators are unambiguously bullish. RSI14 sits at 67.27, pushing toward overboughtbut not yet flashing exhaustion. The MACD line at 1.81 remains above its signal at 1.07, with a positive histogram of 0.75. That is a textbook bullish momentum reading. However, the daily