XRP Price Prediction: Bulls Stalling at $1.62 — $1.68 or $1.46 Within 7 Days

Jessie A Ellis  Sep 26, 2026 07:33 UTC  XRP is trading at $1.55 with its MACD momentum dead flat and price pressing the upper Bollinger Band — a setup screaming for resolution. Smart money is positioned 72% long, but aggressive taker sel…  XRP Is Coiling at the Upper Band — The Easy Gains Are Already Banked  XRP has climbed convincingly above every major moving average on the board — a structurally bullish position that most altcoins in this cycle would trade their left arm for. With the 7-day SMA sitting at $1.53, the 50-day at $1.32, and the 200-day anchored all the way down at $1.28, the trend architecture is clean. But here‘s the uncomfortable truth: at $1.55, XRP is now pressed against the upper Bollinger Band, sitting 86% of the way between the lower and upper band. That’s a zone where the easy-money long trades are already in the rear-view mirror. Yesterday‘s full session range of $1.52 to $1.63 tells you the market has spent most of its recent momentum. What comes next won’t be handed to anyone.  For a macro-sensitive asset like XRP — which has a well-documented habit of trading in lockstep with Bitcoin on risk-off days and amplifying moves in either


1 ہفتوں کے اندرانڈسٹری

BNB Price Prediction: $800 Is the Line in the Sand — Here's What Happens Next

Darius Baruo  Sep 26, 2026 07:24 UTC  BNB is coiling in a tight range just below its pivot at $777, with MACD momentum fully exhausted and smart money sitting heavily long — a reclaim of $786 sets up a run at the $799–$802 supply zone …  Coiling Under Pressure: BNBs Deceptively Quiet Setup  Don‘t let the 0.10% daily move fool you. BNB printing at $773 with a less-than-$22 range on the session isn’t calm — its compression. The asset has stalled just below its intraday pivot at $777.29, sitting beneath the 7-day SMA of $779.22 while the broader trend structure remains firmly intact. Every longer-term moving average — the 20-day at $748, the 50-day at $698, and the 200-day at $633 — is stacked cleanly below current price, which tells you the macro bid is real and this isnt a market in structural distress. This is a market deciding whether to breathe or accelerate.  The BNB ecosystem continues to benefit from Binance Chains dominant position in DeFi throughput and meme coin speculation cycles, and as Blockchain.news has tracked through 2026, regulatory clarity in key Asian markets has provided a persistent underlying bid to BNB that differentiates it from more speculative Layer-1 competitors. The current price

1 ہفتوں کے اندرانڈسٹری

ETH Price Prediction: MACD Flatlines at the $2,700 Pivot — Bull Run or Bull Trap Ahead?

James Ding  Sep 26, 2026 07:16 UTC  Ethereum sits at a razor-thin inflection point near $2,690 with its MACD momentum dead on zero and retail crowding to the long side at nearly 73%. A decisive break above $2,732 puts $2,800 squarely…  Coiling at the Pivot: ETHs Market Setup Is a Loaded Spring  Ethereum is not trending right now — its coiling. Trading at $2,689.88 with a 24-hour gain of a measly 0.61%, ETH has spent the last day grinding in a $75 range between $2,667 and $2,743. That is not indecision born from weakness. Structurally, the macro picture is clean: price sits comfortably above every significant moving average from the 20-day all the way out to the 200-day, which tells you the underlying trend is bullish. But right here, right now, ETH is pressing up against its own short-term ceiling, trading marginally below the 7-day SMA at $2,704 — a subtle tell that the last leg of momentum has stalled.  The broader crypto market backdrop is what traders need to keep watching as the scaffolding here. With funding rates running near-neutral at 0.0066% on the perpetual futures, there is no speculative frenzy baked in — and that is actually a healthy sign. Markets that go

1 ہفتوں کے اندرانڈسٹری

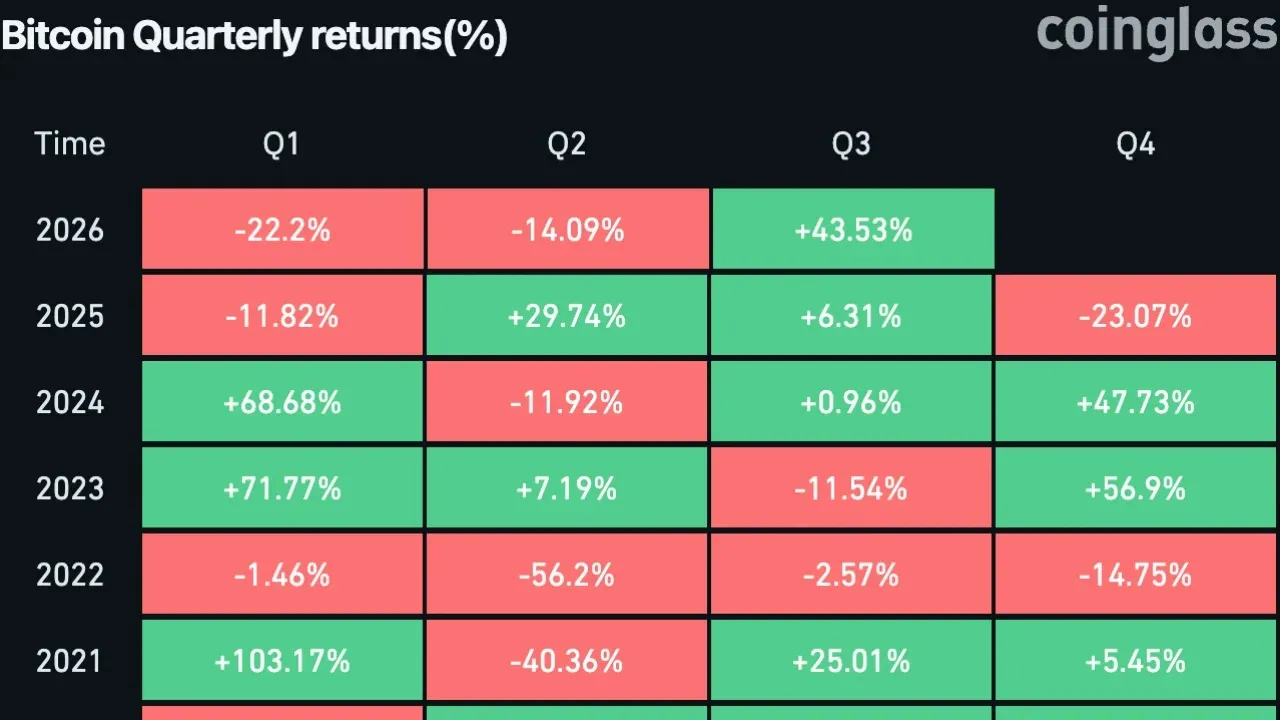
Bitcoin Price Gains 44% for Second-Best Q3 as Ethereum Jumps 71%

Key TakeawaysBitcoin gained 43.5% in Q3 2026, on track for its second-best third quarter on record.Ethereum rose 71.02% in Q3, setting a record as ETF and spot demand strengthened across crypto.Bitcoin faces $96.7K MVRV resistance as Q4 begins with momentum and subdued profit-taking.  Ethereum Jumps 71% as Bitcoin Heads for Historic Q3 Finish  Crypto has turned what is usually one of its quieter quarters into one of the strongest periods in its history.  Bitcoin‘s price has gained roughly 43.5% in Q3 2026, climbing from about $58,500 at the start of the quarter to around $84,000. That puts the quarter on track to become bitcoin’s second-best Q3 ever, behind only the roughly 80.4% surge recorded in 2017.  Ethereum has done even better.  According to Coinglass data, ETH is up 71% this quarter, exceeding its previous Q3 record of about 66.5% set in 2025. The move marks ethereums strongest summer rally on record.  Bitcoin and Ethereum Q3 Performance, as of Sat., Sept. 26. Source: CoinglassBitcoin and Ethereum Break the Usual Q3 Pattern  July, August and September have historically been inconsistent months for crypto, often producing flat or modest returns compared with stronger fourth-quarter periods.  Discover more  Crypto tax software  Network Security  Financing  This year has been different.  Bitcoins advance represents its best Q3 performance since

1 ہفتوں کے اندرانڈسٹری

BTC Price Prediction: $88K or Bust — Bitcoin's Momentum Crossroads Could Define Q4

Lawrence Jengar  Sep 26, 2026 07:08 UTC  Bitcoin is coiling at $83,907 in near-perfect equilibrium, with smart money leaning long and all major moving averages stacked bullishly below price. A clean break above $85,047 flips the probabili…  Coiled at $84K: The Deceptive Stillness of a Market Thats About to Move  Don‘t let the -0.16% daily print fool you. Bitcoin sitting at $83,907 isn’t boring — its loaded. The 24-hour range of just over $2,000 from $83,183 to $85,255 tells you the market is compressing, not sleeping. Volume on Binance spot came in at roughly $1.42 billion, which is adequate but not explosive. This is a market catching its breath, digesting recent gains, and waiting for a catalyst to tip the scales.  What makes this moment particularly interesting is the broader structural context. BTC is trading above every single major moving average — the 7-day, 20-day, 50-day, and 200-day SMAs are all stacked beneath the current price in textbook bullish alignment. The 200 SMA sits down at $71,035, a full 16% below spot, meaning the macro trend is firmly, unambiguously upward. This is not a market where bears hold structural conviction. The path of least resistance, structurally, is still higher — but the short-term setup demands

1 ہفتوں کے اندرانڈسٹری

All about PUMP's 18% surge after SEC's clarification, 398M token buybacks

In a major boost for tokens with protocol revenue and buybacks, SEC staff has now clarified when live tokens, buybacks, and staking receipts are not securities.  SEC securities clarification sparks market optimism  The SEC clarified that it uses the classic Howey test to determine when crypto assets and token sales constitute securities under federal law. The agency posited that the classification mostly focuses on economic reality, rather than terminology.  As such , digital assets fall under securities regulation if investors anticipate profits driven by managerial effort of founders.  At the same time, the SEC also noted that buybacks do not make a commodity into a security and same with liquid staking.  How did PUMPs market react?  Thanks to the SECs clarification, PUMP recorded a major upswing. The altcoin rebounded from its $0.0038 slip, reclaimed and flipped $0.004, and rallied to daily high of $0.0046.  Discover more  Bitcoin price tracker  financing  FINANCE  At the time of writing, PUMP was trading at around $0.0045, up 18% on the daily charts. The price hike was followed by a 57% surge in spot trading volume.  A look at capital flows  With investors incentivized by recent positive developments, PUMPs network saw fresh capital flows.  According to DefiLlama, the protocols USD Inflows rose to $24 million. This marked a notable

1 ہفتوں کے اندرانڈسٹری

Robert Kiyosaki Names 3 Income Types That Separate Rich and Poor

Key TakeawaysKiyosaki divides income into earned, portfolio and passive categories.He associates paychecks with the poor and passive income with the rich.U.S. tax treatment depends on the activity and type of income involved.  Three Income Types, According to Kiyosaki  A paycheck, an investment return, and income from a business can have different tax consequences for the person receiving them. In a Sept. 23 post on X, Rich Dad Poor Dad author Robert Kiyosaki used earned, portfolio, and passive income to describe what he sees as a dividing line between poor, middle-class, and rich people.  Kiyosaki associated earned income with wages from a job and portfolio income with the investments held by many middle-class savers. He described passive income as money that comes in without working. The three labels serve his broader argument that learning the language of money can change how people think about work and wealth. Kiyosaki wrote:  “Study, learn the words of money, because the best news is, words are FREE.”  His reference to 401(k)s and individual retirement accounts follows earlier remarks questioning stock-heavy retirement plans. In the latest post, he places savers who use those accounts in his portfolio-income category. A retirement account, however, is a way to hold investments; the account itself

1 ہفتوں کے اندرانڈسٹری

DoubleZero jumps 29% as OI climbs 113% – Can 2Z outrun its $124M unlock?

DoubleZero [2Z] rallied by more than 29% in the past 24 hours, leading by gains among all the top 200 cryptos by market cap. The rally came amidst a broader crypto market rebound.  How high can 2Z price go?  The charts showed 2Z has been making higher highs and lows since its trendline break. This daily surge cleared liquidity clusters sitting above equal highs of $0.060, amplifying the move past $0.075.  The CVD showed 19.57 million 2Z tokens bought at the hour of the press, confirming the ongoing buying activity. The Stochastic Momentum Index (SMI) was also trading around maximum levels.  Source: 2Z/USDT on TradingView  If the bullish action continues, the next price targets are at $0.095 and $0.120. But for 2Z to hit these levels, it has to stay above $0.075. The altcoins downside risk extends to $0.050, where the trendline was broken.  Discover more  Ethereum market analysis  Bitcoin mining hardware  Install Firewall Software  Why is DoubleZero surging?  As the price of DoubleZero rallied up, its Open Interest (OI) jumped by 113%, which indicates bullish positioning. Similarly, volume rose by 107%, surpassing $50 million at press time.  In fact, data from CoinGlass showed there were $2 million in Cumulative Long Liquidation Leverage as compared to $955K in short orders.  Source: CoinGlass  Moreover, there

1 ہفتوں کے اندرانڈسٹری

Michael Saylor Outlines Five Digital Asset Rights to Power AI-Driven Economy

TLDR:Saylor proposes five core rights: create, issue, custody, transfer, and use digital assets freely.He sets a goal of financing 10 million new companies through faster digital token issuance.Saylor urges banks to custody Bitcoin and extend credit against it under clearer capital rules.He criticizes the CLARITY approach and projects a $100 trillion digital asset industry ahead.  Digital asset rights formed the center of Michael Saylor‘s policy remarks at the Bitcoin Policy Institute’s Freedom Tech DC summit.  Saylor spoke with Conner Brown about a framework built on five freedoms. These include the right to create, issue, custody, transfer, and use digital assets.  He argued that a more productive economy, driven by artificial intelligence, needs better money and better capital markets. Growth in AI output should be matched by growth in financial access, he said.  Five Freedoms Anchor the Policy Framework  Saylors proposal rests on treating digital asset rights as belonging to both individuals and corporations. “Freedom starts with the ability to act,” Saylor said.  Each of the five freedoms serves a distinct purpose, from creating new financial instruments to spending and borrowing against holdings.  Discover more  Crypto market updates  NEWS  Enterprise blockchain solutions  The framework also calls for financing structures that support new business formation. Saylor set a goal of enabling 10 million

1 ہفتوں کے اندرانڈسٹری

Sui Price Reclaims $1 as Analysts Eye Fresh Rally Toward $1.40

Key InsightsSui crypto price reclaimed $1 as buyers returned across spot markets.Analysts identified $1.40 as the next major resistance area.Derivatives activity remained elevated as open interest topped $1 billion.  Sui price extended its weekly recovery on Sept. 26 after reclaiming the $1 area and trading near $1.19. The rebound drew attention after analysts identified $1.40 as the next resistance zone.  The move followed a broader recovery in Sui crypto activity and trading demand. Rising spot volume, derivatives positioning, and new ecosystem releases strengthened the market backdrop without confirming further upside.  Sui Price Extends Recovery Above $1  CoinMarketCap data showed SUI trading near $1.19, up about 17% over 24 hours. Trading volume reached roughly $1.77 billion, while market capitalization approached $4.9 billion.  SUI Crypto Price Chart | Source: CoinMarketCap  The token traded between $1.01 and $1.21 during the same period. That range placed SUI above the $1 level identified by analysts as an important technical pivot.  CoinMarketCap also showed SUIs circulating supply near 4.09 billion tokens. The maximum supply remained capped at 10 billion SUI.  That supply profile matters because price gains can coincide with future token releases. Investors therefore track circulating supply alongside market capitalization when judging valuation shifts.  Discover more  FINANCE  Bitcoin price tracker  Blockchain development tools  Sui Price Structure Points Toward

1 ہفتوں کے اندرانڈسٹری
1
...
4648
...
1000