ATOM Price Prediction: $2.30 Resistance Test or $1.92 Support Break Within Days

Cosmos has established a defined trading range between $2.00 and $2.19, with price action suggesting institutional accumulation rather than retail speculation. The token sits above key moving averages while maintaining elevated trading volumes that indicate serious positioning by larger market participants.  Current price levels represent a convergence of multiple timeframes, where short-term resistance meets longer-term support structures. This technical setup typically precedes significant directional moves as the market resolves the underlying supply and demand imbalance that has kept ATOM range-bound.  Technical Indicator Convergence  Multiple momentum indicators are approaching decision points simultaneously. The Relative Strength Index shows buyers remain engaged without reaching overbought territory, while moving average convergence divergence patterns suggest momentum is building beneath the surface. Blockchain.news technical analysis indicates these conditions often precede volatile price movements.  Bollinger Bands have contracted around current price levels, creating a squeeze formation that historically leads to expansion phases. The combination of tightening volatility bands and neutral momentum readings creates an environment where small catalysts can trigger large moves in either direction.  Price Target Analysis  The immediate resistance zone sits at $2.23, representing the first hurdle for any bullish continuation. A clean break above this level opens the path toward $2.30, where more substantial selling pressure likely awaits based on

05-26

BitMine lost $8 billion on ETH but Tom Lee still made tens of millions

Shares of BitMine Immersion Technologies, trailing 12 months. Source: TradingViewTens of millions for Tom Lee  Five months after those strategic advisor warrants, BitMine asked stockholders to approve a new package for Lee, who had assumed the chairman role.  Despite BitMines common stock languishing 79% below its 52-week high at the time, a majority of voting power agreed on January 15, 2026.  The package was worth up to $95 million in cash over five years. BitMine paid $15 million upfront and committed to $20 million more in fixed payments over four years. The remaining $60 million unlocks only if BitMine hits annual revenue hurdles.  Targets escalate from $200 million in fiscal 2027 to $500 million in fiscal 2030. In addition to the cash, Lee received 1.5 million time-vesting restricted stock units and 4.5 million performance units.  Performance units vest at $125 and $250 share price targets.  Curiously, BitMine‘s board justified the lavish deal by calling Lee a uniquely qualified leader. In actual fact, the company’s ETH treasury was already underwater by more than $4 billion at the time of the January vote, and losses have doubled since then.  Compensation for me, dilution for thee  BitMines common stock has lost 30% of its value year-to-date, and 88% since its 52-week

05-26

Japanese Yen: Bearish bias persist versus US Dollar – UOB

UOBs Quek Ser Leang and Lee Sue Ann note that USD/JPY has stalled into sideways trade after failing to extend losses, with intraday momentum indicators flat. On a 1–3 week view, they still hold a positive US Dollar (USD) bias above strong support, but acknowledge slowing upside momentum. Over the medium term, they see scope for new highs without challenging the 2024 high of 162.00.  Dollar-Yen holds above key support  “24-HOUR VIEW: While we indicated yesterday that ”there is a chance for USD to test 158.70,“ we stated that ”a continued decline below this level is unlikely, and the strong support at 158.40 is unlikely to come under threat.“ The subsequent price movements did not unfold as expected. USD dipped briefly to 158.74 and then traded mostly sideways for the rest of the sessions. Momentum indicators are mostly flat, and further sideways-trading appears likely, probably between 158.75 and 159.20.”  “1-3 WEEKS VIEW: We have held a positive USD view since the middle of the month. In our most recent narrative from last Thursday (21 May, spot at 158.85), we highlighted that ”upward momentum continues to slow, and a breach of 158.40 (‘strong support’ level) would shift the outlook for USD from positive to

05-26

Oil: Extended Hormuz disruption reshapes energy outlook – Rabobank

Rabobank‘s Michael Every argues that the Strait of Hormuz is unlikely to return to normal operations for up to three months, keeping a significant share of global Oil and gas flows constrained. The report highlights risks of further war, demining delays and potential NATO involvement, and warns of a looming energy crunch that will force a revision of Rabobank’s macro and commodity forecasts.  Hormuz closure drives energy crunch risks  “As such, the new base case is that, on balance, Hormuz will not return to normal operation for up to three months (before ending in a ‘disputed’ US victory) – with supply-side damage.”  “However, in political terms, an oil-for-oil deal gains Iran vital FX but loosens its chokehold on the world economy, which is its best leverage. Once the 1,550 ships trapped behind Hormuz exit with a huge one-off supply of energy, it would find itself in a far weaker bargaining position.”  “Moreover, in physical terms, demining Hormuz could take longer than 30 days even if Iran has a better idea of where it has laid them, before drift, than the US does. Some estimates are it could take six weeks, which would already mean mid-July as an opening date.”  “The second option can mean US

05-26

Ethereum Price Roadmap For The Rest Of 2026: Bull, Base, And Bear Scenarios Unpacked

Ronaldo is an experienced crypto enthusiast dedicated to the nascent and ever-evolving industry. With over five years of extensive research and unwavering dedication, he has cultivated a profound interest in the world of cryptocurrencies.  Ronaldos journey began with a spark of curiosity, which soon transformed into a deep passion for understanding the intricacies of this groundbreaking technology.  Driven by an insatiable thirst for knowledge, Ronaldo has delved into the depths of the crypto space, exploring its various facets, from blockchain fundamentals to market trends and investment strategies. His tireless exploration and commitment to staying up-to-date with the latest developments have granted him a unique perspective on the industry.  One of Ronaldos defining areas of expertise lies in technical analysis. He firmly believes that studying charts and deciphering price movements provides valuable insights into the market. Ronaldo recognizes that patterns exist within the chaos of crypto charts, and by utilizing technical analysis tools and indicators, he can unlock hidden opportunities and make informed investment decisions. His dedication to mastering this analytical approach has allowed him to navigate the volatile crypto market with confidence and precision.  Ronaldo‘s commitment to his craft goes beyond personal gain. He is passionate about sharing his knowledge and insights with others,

05-26

Bitcoin, Ethereum ETFs Shed $112M as Hyperliquid Funds Extend 8-Day Win Streak

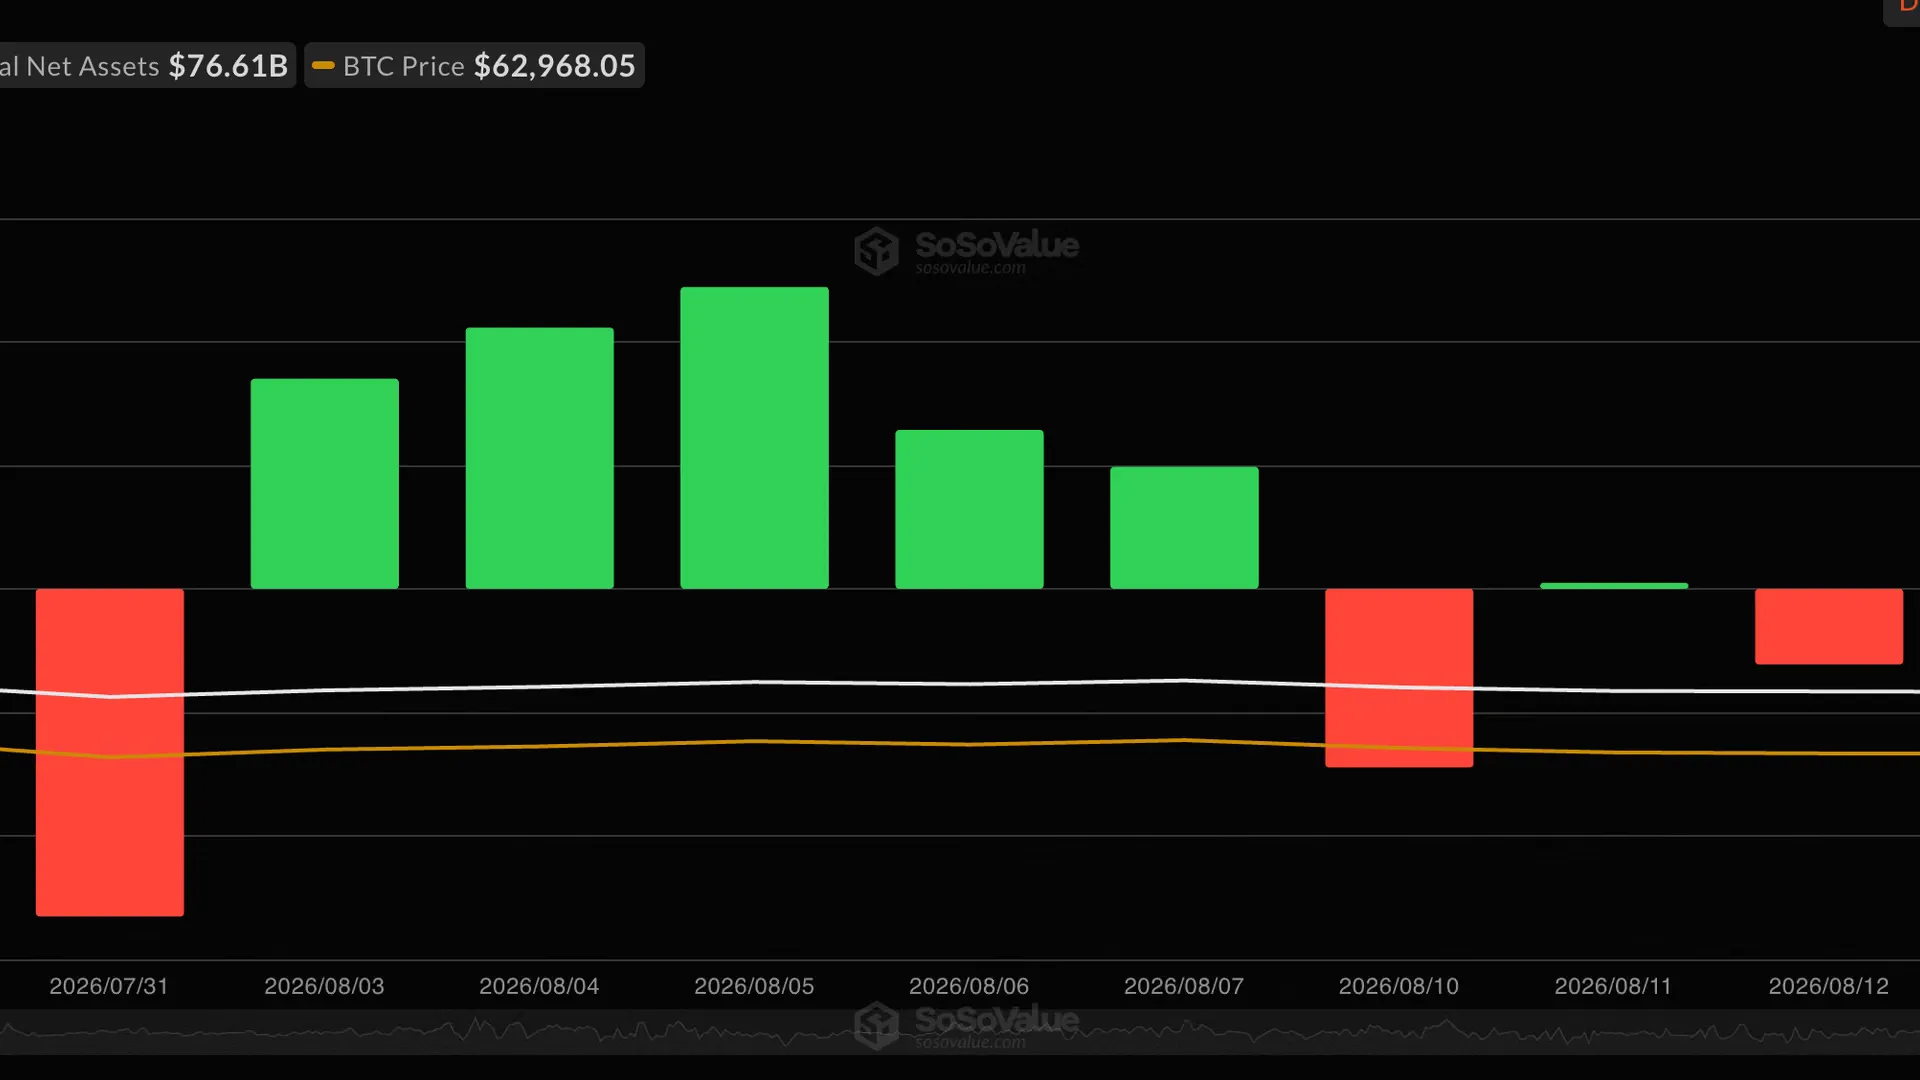
Bitcoin ETFs saw $105 million in outflows on Monday, while Ethereum ETFs shed $6.7 million as risk-off sentiment intensified amid Iran tensions.Two HYPE ETFs have posted net buying for eight consecutive days, adding $10.95 million on Monday and $25.5 million last week.Bitcoin traded at $76,700, down 0.7% over 24 hours, as Myriad users reduced the chances of a rally to $84,000 to 74%.  Bitcoin and Ethereum exchange-traded funds posted $112 million in combined outflows on Monday, while two Hyperliquid ETFs extended their winning streak to eight consecutive days of net buying.  The divergence highlights a growing split in institutional appetite: legacy crypto funds are bleeding capital amid macro uncertainty, while newer products tied to Hyperliquids high-growth infrastructure thesis continue to attract demand.  Bitcoin ETFs led the losses with $105.2 million in outflows, while Ethereum ETFs shed $6.7 million, according to SoSoValue data. The moves come as digital asset investment products recorded $1.47 billion in outflows last week, making it the third-largest weekly total of 2026, according to CoinShares.  Bitcoin ETFs alone saw $1.315 billion in outflows, the largest weekly outflow of the year, while Ethereum funds recorded $223 million in outflows. CoinShares attributed the risk-off sentiment to ongoing geopolitical tensions related to the Iran

05-26

Bitcoins April recovery showed signs of structural accumulation

April 2026 will be remembered not for explosive gains but for structural repair. After a brutal February and March, marked by sharp drawdowns, leverage flushes, and sentiment washouts that left Bitcoin grinding below $70,000, the market staged a methodical recovery that closed the month near $76,300, representing an approximate 11–12% gain.  That figure understates what actually happened beneath the surface. The recovery was architectural: higher lows replaced lower lows, positive cumulative volume delta (CVD) persisted across all major exchanges simultaneously for the first time since July 2025, and genuine altcoin rotation began to materialize. This was not a short squeeze. It was a climb built on institutional conviction and improving market structure.  Macro and geopolitics: the Strait of Hormuz as the central risk Toggle  Every meaningful price move in April traced back to a single 33-kilometer waterway. The U.S.–Iran conflict and its grip on the Strait of Hormuz functioned as the dominant on/off switch for global risk appetite, with Bitcoin ($BTC) responding in near real-time to each development.  The month opened in a standoff. Iran had submitted a ten-point counteroffer to U.S. proposals, and Trump threatened to destroy Iranian oil infrastructure if no deal materialized.  On April 7th, just ahead of a self-imposed deadline, a

05-26

Ethereum price at $2,100 as Vitalik denies selling: rebound next?

Ethereum traded near $2,100 on May 26, according to crypto.news price data.   Meanwhile, the token was down 0.12% over 24 hours and 1.7% over seven days. Its 24-hour trading volume stood at $9.72 billion, while market capitalization reached $253.25 billion.  The same data showed Ethereum moving between $2,080 and $2,140 during the day. That kept $ETH close to the wider $2,000 to $2,100 support zone that traders have watched since the latest pullback.  Short-term indicators still show weak momentum. The Awesome Oscillator was negative at -153.30, meaning sellers still control the current trend. The Chaikin Money Flow was also slightly negative at -0.04, pointing to mild capital outflow rather than strong accumulation.  Ethereum ($ETH) price chart, source: crypto.news  Volume stood near 46.84K on the chart, which looked moderate compared with earlier selloff spikes. That means the move lower has not yet shown clear panic selling. A recovery above $2,300 to $2,400 would improve the setup, while a loss of $2,000 would raise downside pressure.  Vitalik Buterin denies selling Ethereum  Ethereum co-founder Vitalik Buterin also became part of the market discussion after Ali Martinez posted a price analysis titled “I‘m NOT selling Ethereum!” The post linked the price setup to Buterin’s comments about the Ethereum Foundations future

05-26

Bitcoin stabilizes near $77K – Here‘s why BTC’s recovery is still far away

Bitcoin market sentiment weakened sharply after the price lost the broader $79K support region and slipped toward the $74K demand zone recently.  That breakdown also exposed deeper leverage fragility because aggressive liquidations quickly amplified sell-side pressure across broader markets.  Major exchanges later reflected widening sell imbalances as defensive positioning and cascading long liquidations weakened short-term confidence further.  However, signs of seller exhaustion gradually started emerging once Spot Taker CVD improved across Binance and Coinbase after the decline. Buyers also absorbed downside liquidity more efficiently as panic-driven momentum slowly faded beneath current conditions.  Meanwhile, Bitcoin stabilized near the broader $76.5K–$77K region while short-term flows shifted closer toward neutrality. Yet, weaker momentum and damaged structure still leave markets vulnerable to renewed volatility unless higher support zones continue holding.  Bitcoins supply overhang keeps recovery pressure elevated  Bitcoin market pressure increasingly shifted from panic-driven selling toward broader supply absorption once liquidation momentum started easing recently.  Buyers also stabilized short-term flows more effectively as aggressive sell-side pressure gradually weakened beneath current market conditions.  However, roughly 7.75 million $BTC remained below the holder cost basis near the broader $77,000 region across markets.  That figure also represented nearly 39% of circulating supply, reflecting heavy unrealized loss pressure beneath damaged market structure conditions.  Source: Glassnode  Historical cycles later showed

05-26

8Blocks Partners with CertiK to Bring Economic and Security Readiness to Token Launches

Before a token reaches investors, exchanges, and users, the project must prove both the strength of its economic model and the reliability of its infrastructure. The model includes utility, incentives, demand logic, circulation, and connection to the product. The infrastructure includes smart contract security, protocol behavior, monitoring, and exposure to vulnerabilities after deployment.  8Blocks and CertiK bring these areas into one preparation track, helping teams reduce structural and security risks before they become public problems.  Why this matters before TGE  A token generation event turns internal assumptions into public tests. If the model is weak, user growth can become sell pressure. If the smart contract carries unresolved vulnerabilities, trust can break before the project has time to scale.  Both areas need validation before listing conversations begin. CertiK strengthens the security foundation through audits, assessments, monitoring, risk evaluation, and transparency tools. 8Blocks prepares the tokens economic logic through token economy design, tokenomics validation, go-to-market advisory, ecosystem partnerships, and growth preparation. Security and economic design solve different risks. A project preparing for TGE needs both.  From development to public readiness  Many projects treat tokenomics, smart contract auditing, and launch preparation as separate steps. That separation creates blind spots.  A token can have clean code and still fail because the

05-26
1
...
342344
...
1000